The Cypriot established Blue Economy sectors employ about 37 000 people and generate around €946 million in GVA. The Blue Economy has an extremely positive impact on the Cypriot workforce, employing roughly 8.5% of the national workforce. This share has increased on a year-to-year basis (5.9% in 2020). Cyprus has recorded an increase in contribution of Blue Economy sectors to the overall GVA, moving from 2.0% in 2020 to 4.3% in 2021.
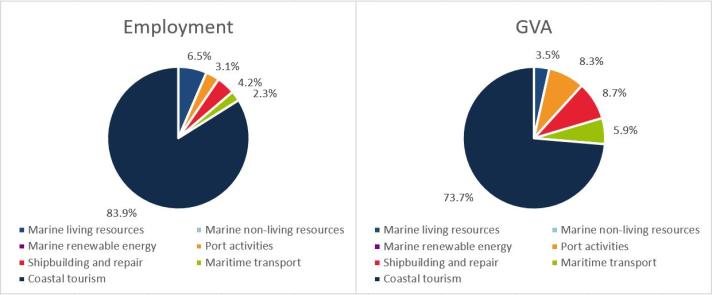
The Cypriot Blue Economy is dominated by Coastal tourism, which contributes to 84% of Cypriot blue jobs and 74% to GVA, in 2021. The tourism sector is recovering from the COVID-19 pandemic, with employment and GVA increasing from 77% and 42% in 2020. However, 2021 values are still slightly lower than those recorded pre-Covid (i.e. in 2019, 89% for employment and 84% for GVA).

Text description of images at the bottom of the page
The sectors that employ the second and third biggest shares of blue workers are Marine Living resources (7%) and Shipbuilding and repair (4%). In terms of GVA, Shipbuilding and repair, and Port activities contribute to an overall 17% of the entire national Blue Economy.
The busiest ports in Cyprus are: Port of Zygi (194th busiest port in EU in terms of gross weight of goods handled) and Port of Lemesos (210th).
In terms of passengers embarked and disembarked in ports, Lemesos is the first ranked Cypriot port, however it only ranked 398th in 2021 in EU.

In 2021, Cyprus established a Policy Statement on Maritime Spatial Planning under the coordination of the Shipping Deputy Ministry, setting its vision, priorities, goals and strategic guidelines for the sustainable growth of its Blue Economy. In 2023, Cyprus established its first Maritime Spatial Plan, aiming to facilitate the sustainable exploitation and growth of its marine waters, focusing on the Blue Economy sectors of fisheries, aquaculture, energy (including offshore renewable energy), maritime and coastal tourism, shipping and ports, as well as promoting cultural heritage and the scientific research and knowledge.
The Cyprus Marine & Maritime Institute (CMMI) seeks to drive sustainable blue growth by addressing the needs of industry and society. In 2022, the CMMI published a report on the emerging challenges and prospects of the Blue Economy, highlighting the role of green transport, renewable energy source, and the production of healthy food. The report also calls for the collection of relevant (Blue Economy) data at national level, research and investments in infrastructures.
For more national level data, please visit the Dashboards section within the EU Blue Economy Observatory, where you can also find information about Educational and Employment opportunities in the Blue Economy sectors.
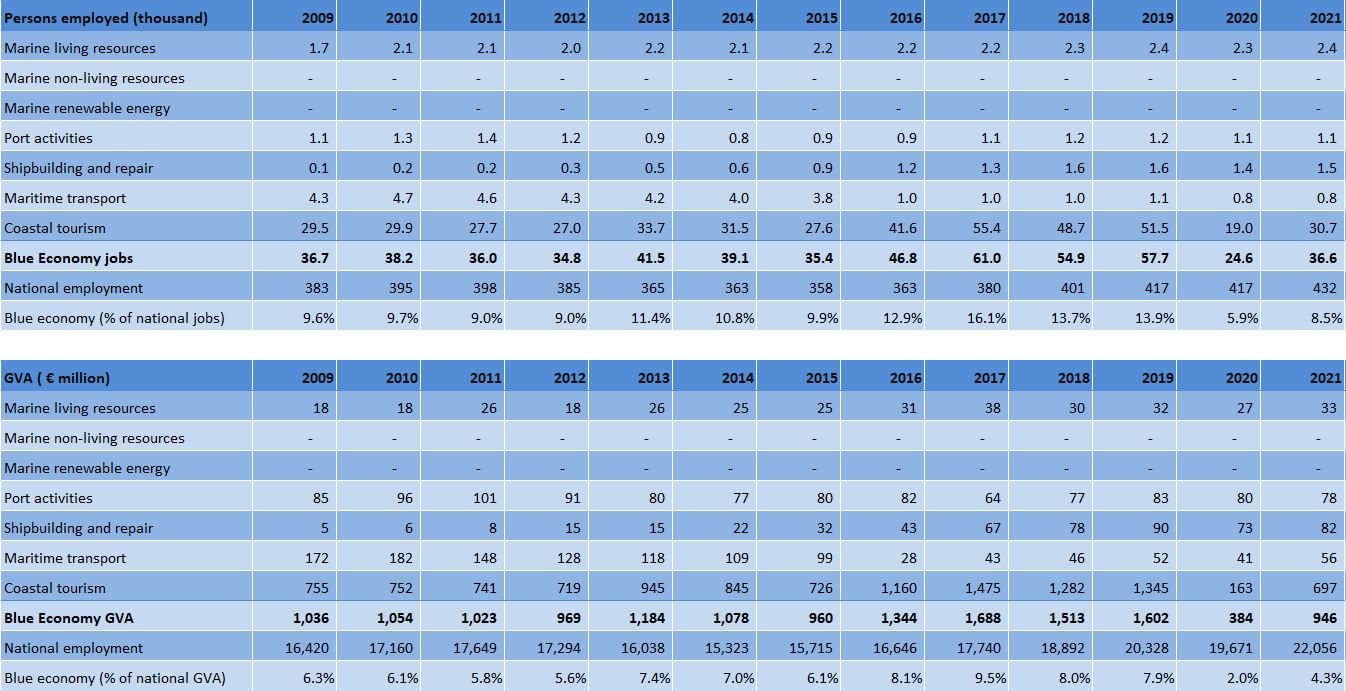
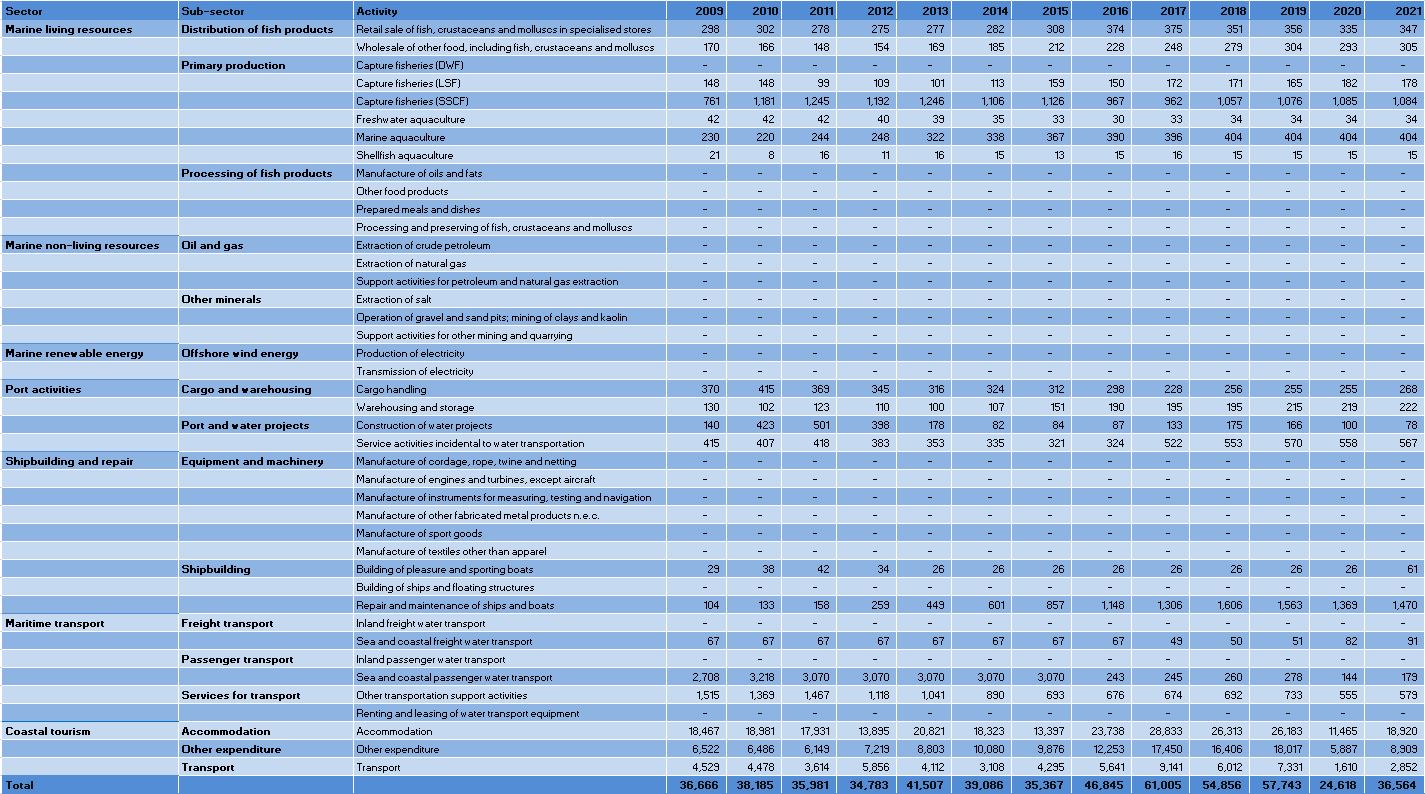
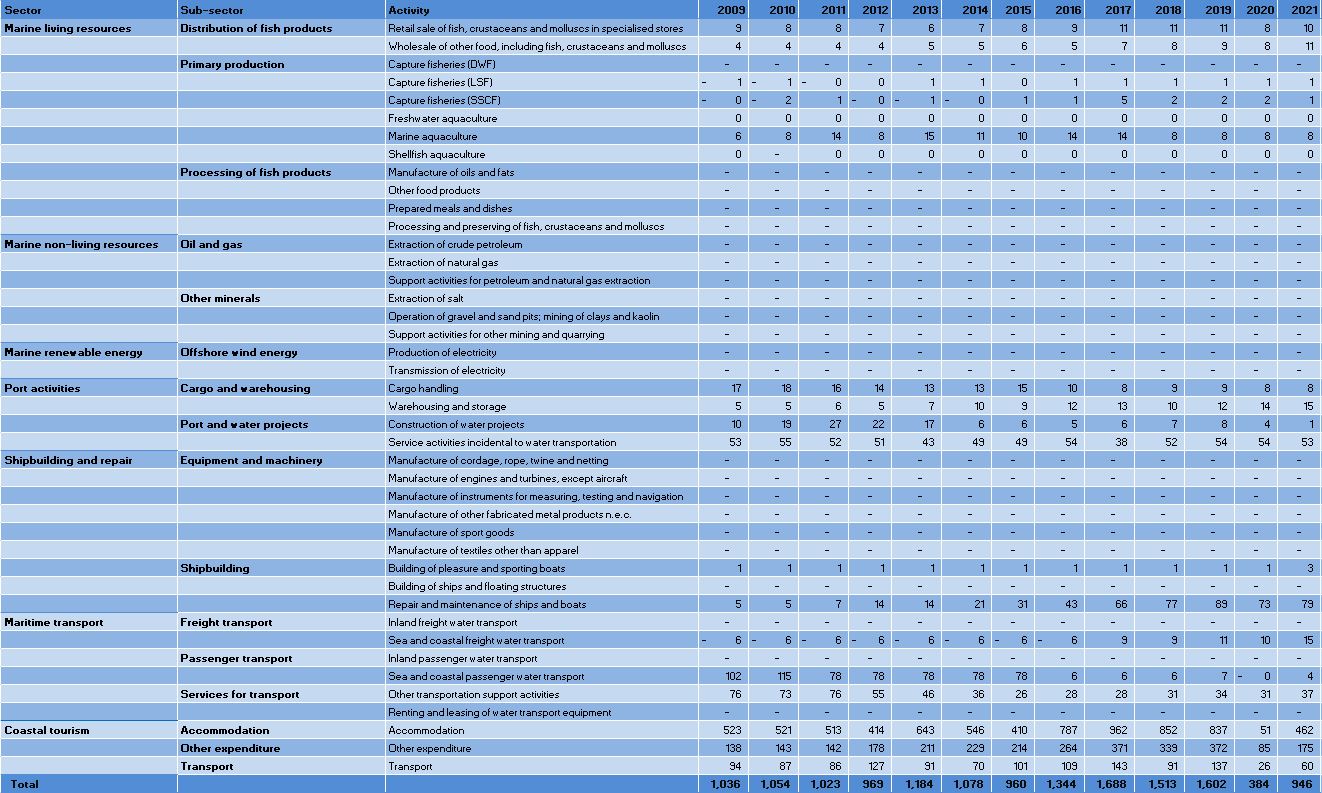
Figure 1: Cyprus: Evolution of the Blue Economy Established Sectors (2021)
This figure consists of two pie charts that illustrate key aspects of Cyprus's Blue Economy in 2021.
- Left Pie Chart: This chart represents the percentage of employment across various established sectors within the Blue Economy. Each sector is depicted as a segment of the pie, with the size of each segment corresponding to its share of total employment. For example, if the segment for "Coastal Tourism" occupies a larger portion, it indicates a higher percentage of employment in that sector compared to others.
- Right Pie Chart: This chart shows the percentage of Gross Value Added (GVA) for each established sector. Similar to the left chart, each segment reflects the contribution of that sector to the overall GVA of the Blue Economy. A larger segment signifies a greater economic impact from that sector.
Together, these charts provide a visual representation of both employment distribution and economic contribution within Cyprus's Blue Economy, highlighting the sectors that play significant roles in both areas.
Figure 2: Cyprus: Evolution of the Blue Economy established sectors (2009-2021)
This figure consists of two tables that illustrate the evolution of established sectors within the Blue Economy in Cyprus from 2009 to 2021.
First table:
- Structure: The first table has 11 rows and 14 columns.
- Column Overview:
- First Column: Lists the established sectors of the Blue Economy, from row 2 to row 10.
- Columns 2 to 14: Display the number of persons employed (in thousands) for each year from 2009 to 2021.
- First Row: Contains the headers, namely: the title followed by the years from 2009 to 2021, one for each column.
- Last Row: Contains the percentage of national jobs attributed to each sector for each year.
- Structure: The second table mirrors the first, also containing 11 rows and 14 columns.
Second table:
- Column Overview:
- First Column: Again lists the established sectors of the Blue Economy, from row 2 to row 10.
- Columns 2 to 14: Present the Gross Value Added (GVA) for each year (in million euros, M€) from 2009 to 2021.
- First Row: Contains the headers, namely: the title followed by the years from 2009 to 2021, one for each column.
- Last Row: Displays the percentage of national GVA for each sector for each year.
Figure 3: Cyprus: Evolution of the Employment by Blue Economy Activity (2009-2021) - Persons employed
This table provides a comprehensive overview of employment trends in Cyprus's Blue Economy from 2009 to 2021. It consists of 44 rows and 16 columns, with the first row serving as the header that outlines the content of each column, namely: the title followed by the years from 2009 to 2021, one for each column.
- The first three columns include:
- Blue Economy Sector
- Sub-Sector
- Activity
- The next 13 columns display the number of persons employed in each activity for each year from 2009 to 2021. Each cell in these columns contains numerical data representing the employment figures for that specific activity and year.
- The last row (row 44) the last row of the table summarises the total number of persons employed for each year, providing a clear overview of employment trends across the entire Blue Economy.
Overall, this table encompasses 7 sectors, 13 sub-sectors, and 42 activities, making it a valuable resource for analysing how employment in Blue Economy has evolved over the specified period in the specific country.
Figure 4: Cyprus: Evolution of the GVA by Blue Economy Activity (2009-2021) - M€"
This figure provides a comprehensive overview of the Gross Value Added (GVA) across various activities within the Blue Economy. It consists of 44 rows and 16 columns with the first row serving as the header that outlines the content of each column, namely: the title followed by the years from 2009 to 2021, one for each column.
- The first three columns include:
- Blue Economy Sector
- Sub-Sector
- Activity
- The next 13 columns display the GVA values for each activity from 2009 to 2021.
- The last row (row 44) summarises the totals for each year.
The table encompasses 7 sectors, 13 sub-sectors, and 42 activities, allowing for a detailed analysis of how the GVA has evolved over the specified years. This structured format facilitates comparisons across different sectors and activities, highlighting trends and changes within the Blue Economy in Cyprus.