The Estonian established Blue Economy sectors employ about 21 000 people and generate around €662 million in GVA. Historically, the Blue Economy was an important part of the overall national economy. In 2021, roughly 3.3% of the national workforce was employed in blue activities, in decline from 2020 (3.8%) and from pre-Covid (in 2019, 5.6%). A similar trend is observed in the overall contribution to the GVA: the Blue Economy value added is 2.4% in 2021, lower than the values in 2020 (3.0%) and 2019 (4.2%).
In terms of employment, the Estonian Blue Economy is dominated by Coastal tourism in 2021, with 40% of blue workers employed in this sector. The share has decreased compared to 2020 (48%) and 2019 (66%). The persons employed in the other sectors Shipbuilding and repair, Port activities, Marine living resources and Maritime transport represent between 12% and 17% of the total Blue Economy workforce.


Text description of images at the bottom of the page
In terms of GVA, Port activities contributes to 34% the Blue Economy GVA, displaying a nominal value smaller than the previous year (€225m vs €240m) but a similar contribution in percentage.
In the EU, Estonia is the 14th-largest contributor in terms of GVA and employment for Maritime transport.
The busiest Estonian container port in terms of the gross weight of goods handled in 2021 is the Port of Tallinn, which ranks 49th in the EU, followed by the Port of Sillamäe (94th).
Regarding passengers embarking and disembarking in ports, the port of Tallinn was the first ranked in Estonia and the 17th busiest in the EU in 2021. Other busy passenger ports are Kuivastu and Virtsu (46th).

Estonia will receive €97 M from the EMFAF to enhance the national Blue Economy. Specifically, the resources will be dedicated to sustainable fisheries and conservation of aquatic biological resources (35%), aquaculture, processing, and marketing (38%), and coastal areas (22%).
Research institutes that deal with blue economy activities and funding opportunities are the TAL Tech and the Estonian Research Council.
For more national level data, please visit the Dashboards section within the EU Blue Economy Observatory, where you can also find information about Educational and Employment opportunities in the Blue Economy sectors.

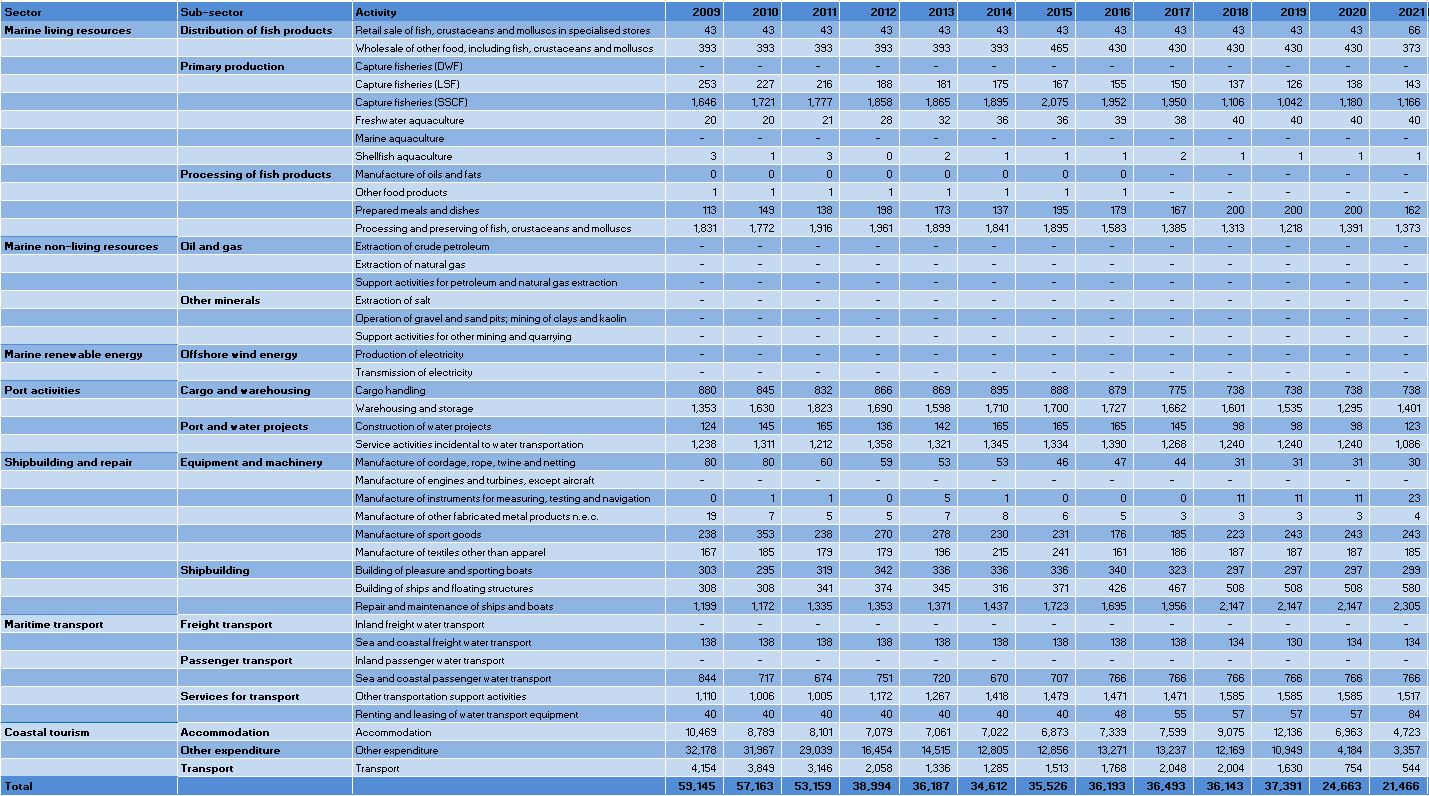
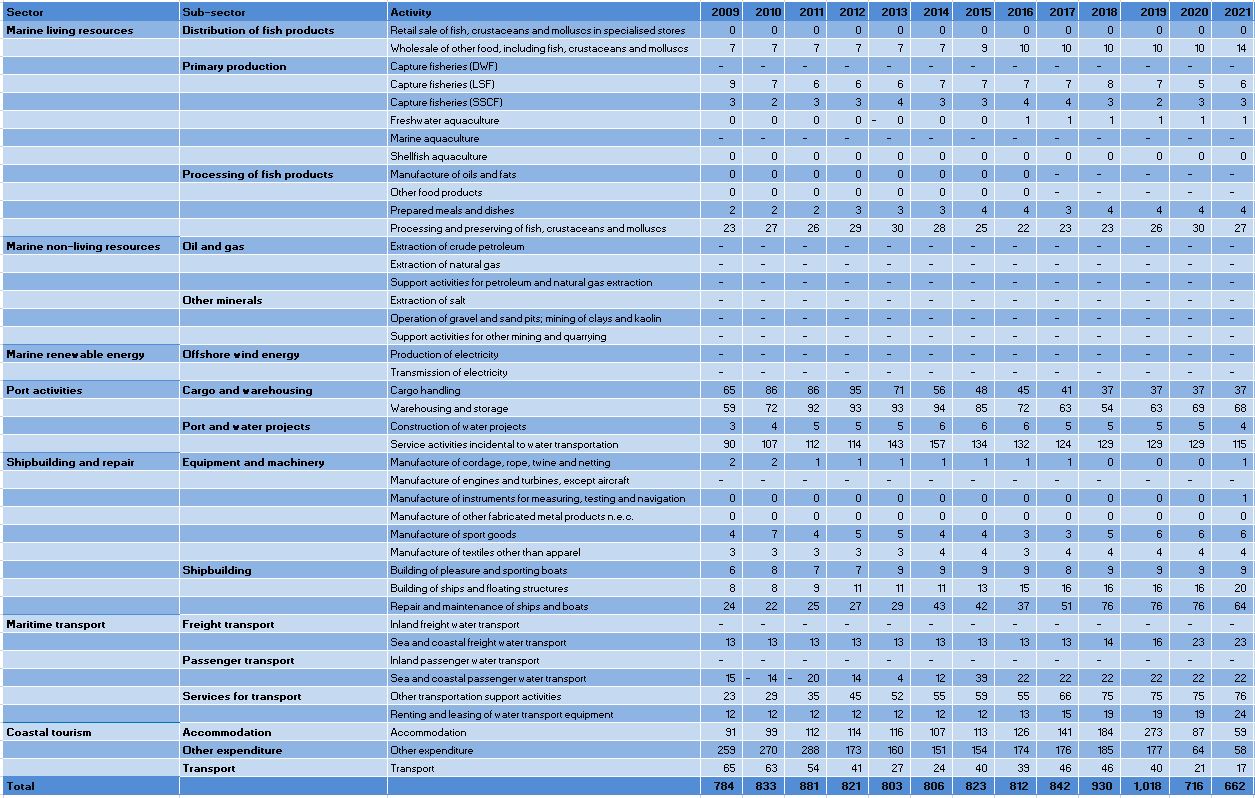
Figure 1: Estonia: Evolution of the Blue Economy Established Sectors (2021)
This figure consists of two pie charts that illustrate key aspects of Estonia's Blue Economy in 2021.
- Left Pie Chart: This chart represents the percentage of employment across various established sectors within the Blue Economy. Each sector is depicted as a segment of the pie, with the size of each segment corresponding to its share of total employment. For example, if the segment for "Coastal Tourism" occupies a larger portion, it indicates a higher percentage of employment in that sector compared to others.
- Right Pie Chart: This chart shows the percentage of Gross Value Added (GVA) for each established sector. Similar to the left chart, each segment reflects the contribution of that sector to the overall GVA of the Blue Economy. A larger segment signifies a greater economic impact from that sector.
Together, these charts provide a visual representation of both employment distribution and economic contribution within Estonia's Blue Economy, highlighting the sectors that play significant roles in both areas.
Figure 2: Estonia: Evolution of the Blue Economy established sectors (2009-2021)
This figure consists of two tables that illustrate the evolution of established sectors within the Blue Economy in Estonia from 2009 to 2021.
First table:
- Structure: The first table has 11 rows and 14 columns.
- Column Overview:
- First Column: Lists the established sectors of the Blue Economy, from row 2 to row 10.
- Columns 2 to 14: Display the number of persons employed (in thousands) for each year from 2009 to 2021.
- First Row: Contains the headers, namely: the title followed by the years from 2009 to 2021, one for each column.
- Last Row: Contains the percentage of national jobs attributed to each sector for each year.
- Structure: The second table mirrors the first, also containing 11 rows and 14 columns.
Second table:
- Column Overview:
- First Column: Again lists the established sectors of the Blue Economy, from row 2 to row 10.
- Columns 2 to 14: Present the Gross Value Added (GVA) for each year (in million euros, M€) from 2009 to 2021.
- First Row: Contains the headers, namely: the title followed by the years from 2009 to 2021, one for each column.
- Last Row: Displays the percentage of national GVA for each sector for each year.
Figure 3: Estonia: Evolution of the Employment by Blue Economy Activity (2009-2021) - Persons employed
This table provides a comprehensive overview of employment trends in Estonia's Blue Economy from 2009 to 2021. It consists of 44 rows and 16 columns, with the first row serving as the header that outlines the content of each column, namely: the title followed by the years from 2009 to 2021, one for each column.
- The first three columns include:
- Blue Economy Sector
- Sub-Sector
- Activity
- The next 13 columns display the number of persons employed in each activity for each year from 2009 to 2021. Each cell in these columns contains numerical data representing the employment figures for that specific activity and year.
- The last row (row 44) the last row of the table summarises the total number of persons employed for each year, providing a clear overview of employment trends across the entire Blue Economy.
Overall, this table encompasses 7 sectors, 13 sub-sectors, and 42 activities, making it a valuable resource for analysing how employment in Blue Economy has evolved over the specified period in the specific country.
Figure 4: Estonia: Evolution of the GVA by Blue Economy Activity (2009-2021) - M€"
This figure provides a comprehensive overview of the Gross Value Added (GVA) across various activities within the Blue Economy. It consists of 44 rows and 16 columns with the first row serving as the header that outlines the content of each column, namely: the title followed by the years from 2009 to 2021, one for each column.
- The first three columns include:
- Blue Economy Sector
- Sub-Sector
- Activity
- The next 13 columns display the GVA values for each activity from 2009 to 2021.
- The last row (row 44) summarises the totals for each year.
The table encompasses 7 sectors, 13 sub-sectors, and 42 activities, allowing for a detailed analysis of how the GVA has evolved over the specified years. This structured format facilitates comparisons across different sectors and activities, highlighting trends and changes within the Blue Economy in Estonia.