

The Greek established Blue Economy sectors employ about 446 000 people and generate around €6.5 billion in GVA. In 2021, the Blue Economy employed roughly 11.4% of the national workforce, an increase from 6.8% recorded in 2020 and almost back to pre-Covid levels (14.6% in 2019). Greek Blue Economy contributed to 4.1% of the national GVA in 2021, an increase from 2.3% recorded in 2020 but still lagging behind the value recorded in 2019 (5.5%).
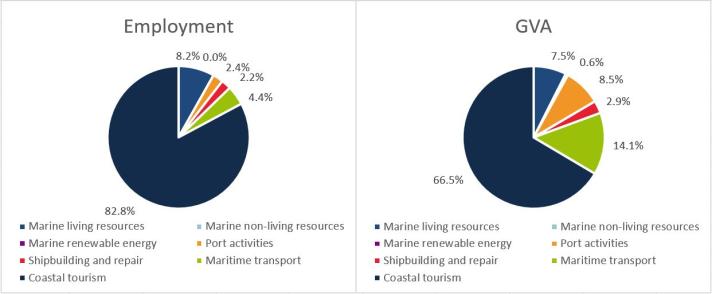
The Greek Blue Economy is mainly driven by Coastal tourism activities in terms of employment, with 83% of blue workers employed in this sector in 2021. The share has increased since 2020 (70%) and is similar to the value recorded pre-Covid (in 2019, 85%). Persons employed in the sector Marine living resources amount to 8% of the Blue Economy workforce, whilst the other sectors make a very marginal contribution to the workforce.
Text description of images at the bottom of the page

In terms of GVA, Coastal tourism contributes the most to the Blue Economy GVA (67%), an increase from 2020 (26%) and in line with pre-Covid values. The second largest contribution to the Greek Blue Economy is provided by Maritime transport activities (14%).
In the EU, Greece is the 5th and 2nd largest contributor in terms of GVA and employment for Coastal tourism in 2021. Greece is also an important contributor to the employment within Marine living resources and Maritime transport (ranked 6th in EU), and to the GVA within Marine non-living resources (7th in the EU) and Maritime transport (8th in EU).
In 2021, the busiest Greek container ports in terms of the gross weight of goods handled were the Port of Piraeus (ranked 19th in the EU for the year), the Port of Agioi Theodoroi (40th), and the Port of Thessaloniki (65th).
Regarding passengers embarking and disembarking in ports, the port of Piraeus is the first ranked in Greece and the 3rd busiest in the EU in 2021. Other busy passenger ports are Paloukia Salaminas and Perama (4th).

The Hellenic Centre for Marine Research is a governmental research organisation that includes three institutes of research: the Institute of Marine Biology Biotechnology and Aquaculture, the Institute of Marine Biological Resources and Inland Waters, and the Institute of Oceanography. These institutes carry out research on many relevant topics for the blue economy.
For more national level data, please visit the Dashboards section within the EU Blue Economy Observatory, where you can also find information about Educational and Employment opportunities in the Blue Economy sectors.
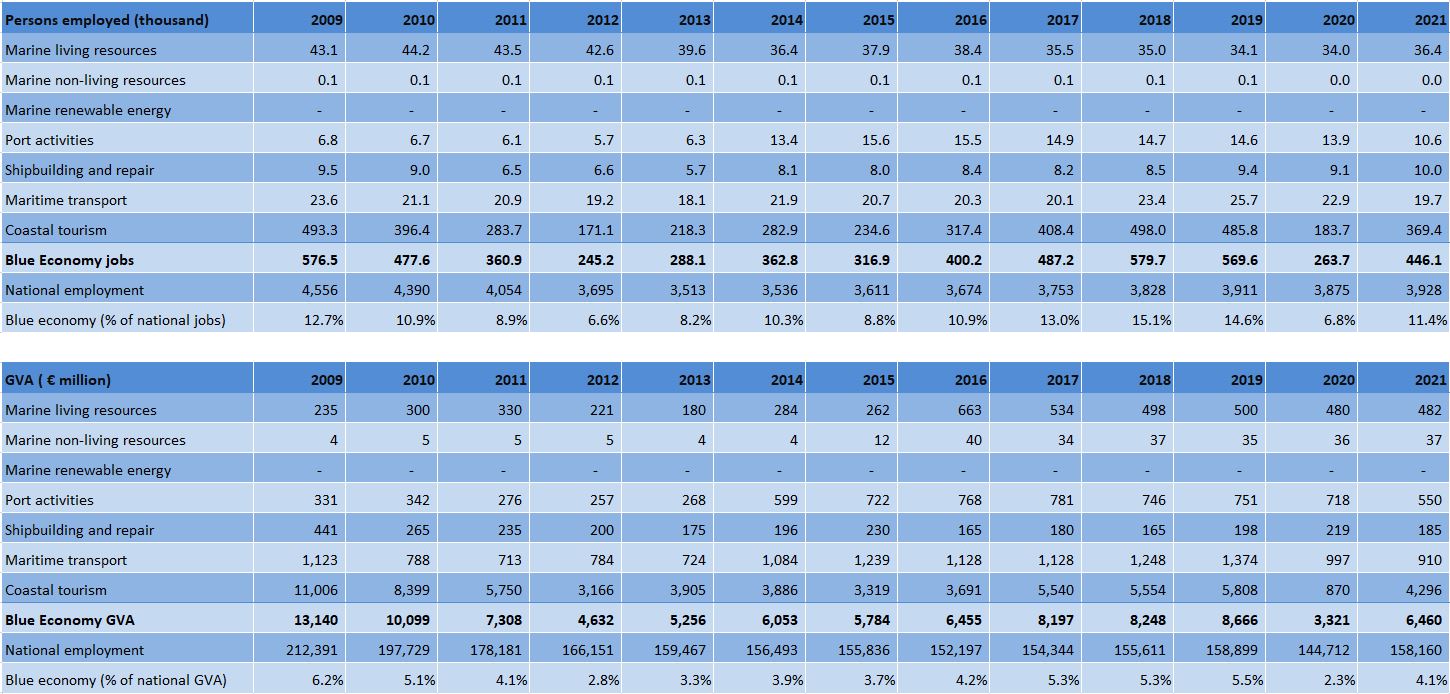
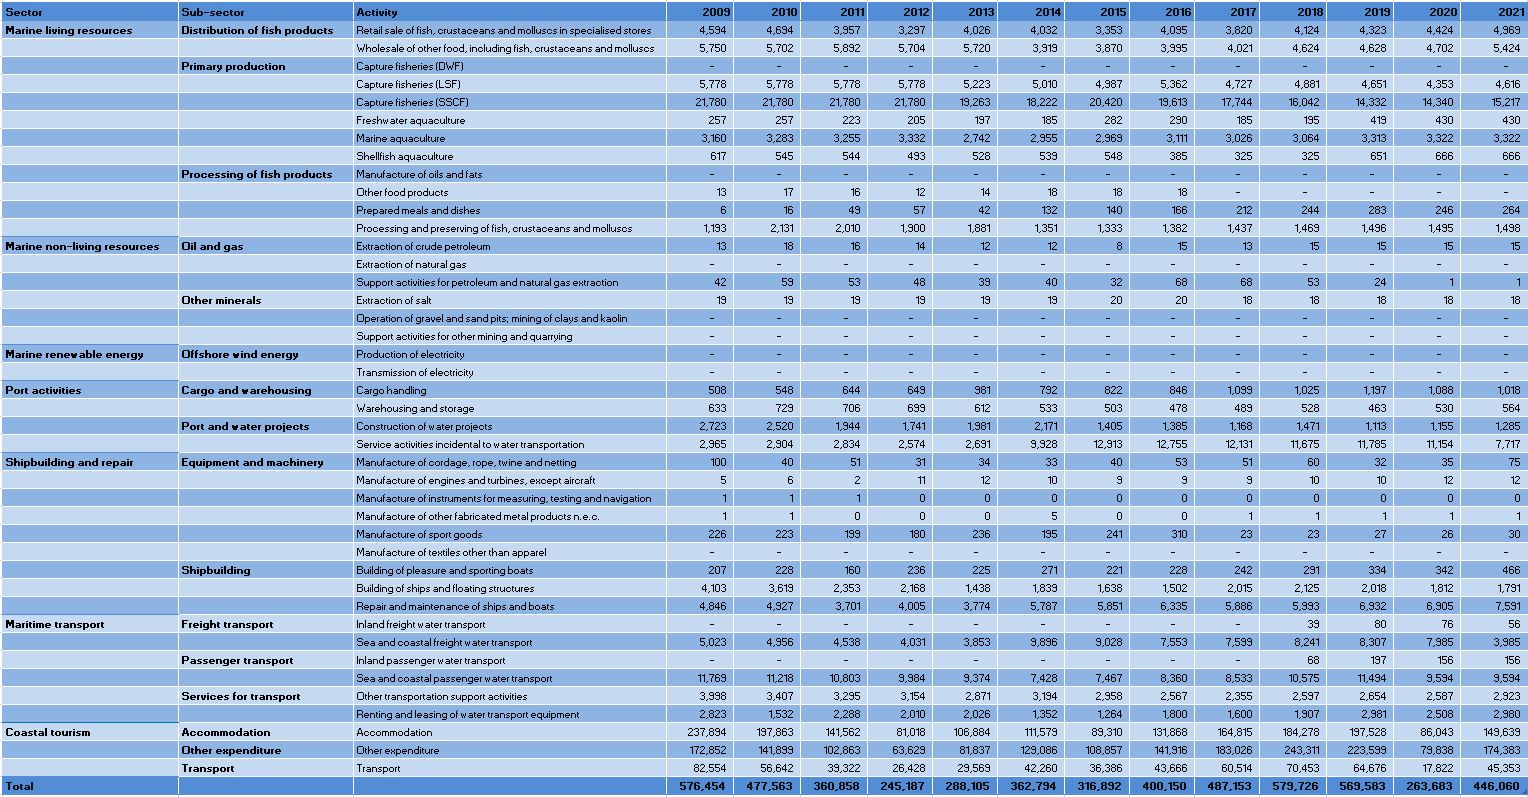
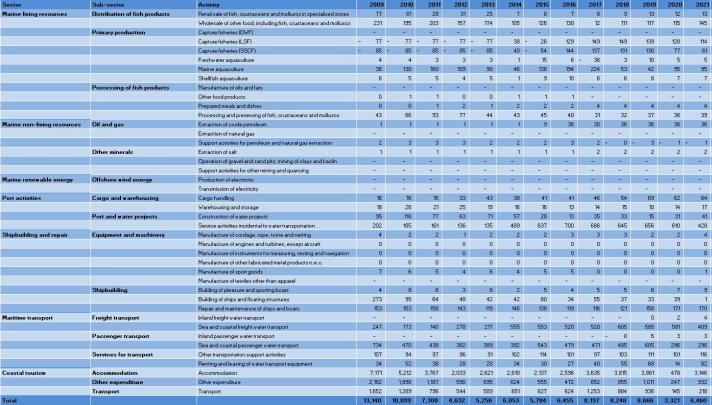
Figure 1: Greece: Evolution of the Blue Economy Established Sectors (2021)
This figure consists of two pie charts that illustrate key aspects of Greece's Blue Economy in 2021.
- Left Pie Chart: This chart represents the percentage of employment across various established sectors within the Blue Economy. Each sector is depicted as a segment of the pie, with the size of each segment corresponding to its share of total employment. For example, if the segment for "Coastal Tourism" occupies a larger portion, it indicates a higher percentage of employment in that sector compared to others.
- Right Pie Chart: This chart shows the percentage of Gross Value Added (GVA) for each established sector. Similar to the left chart, each segment reflects the contribution of that sector to the overall GVA of the Blue Economy. A larger segment signifies a greater economic impact from that sector.
Together, these charts provide a visual representation of both employment distribution and economic contribution within Greece's Blue Economy, highlighting the sectors that play significant roles in both areas.
Figure 2: Greece: Evolution of the Blue Economy established sectors (2009-2021)
This figure consists of two tables that illustrate the evolution of established sectors within the Blue Economy in Greece from 2009 to 2021.
First table:
- Structure: The first table has 11 rows and 14 columns.
- Column Overview:
- First Column: Lists the established sectors of the Blue Economy, from row 2 to row 10.
- Columns 2 to 14: Display the number of persons employed (in thousands) for each year from 2009 to 2021.
- First Row: Contains the headers, namely: the title followed by the years from 2009 to 2021, one for each column.
- Last Row: Contains the percentage of national jobs attributed to each sector for each year.
- Structure: The second table mirrors the first, also containing 11 rows and 14 columns.
Second table:
- Column Overview:
- First Column: Again lists the established sectors of the Blue Economy, from row 2 to row 10.
- Columns 2 to 14: Present the Gross Value Added (GVA) for each year (in million euros, M€) from 2009 to 2021.
- First Row: Contains the headers, namely: the title followed by the years from 2009 to 2021, one for each column.
- Last Row: Displays the percentage of national GVA for each sector for each year.
Figure 3: Greece: Evolution of the Employment by Blue Economy Activity (2009-2021) - Persons employed
This table provides a comprehensive overview of employment trends in Greece's Blue Economy from 2009 to 2021. It consists of 44 rows and 16 columns, with the first row serving as the header that outlines the content of each column, namely: the title followed by the years from 2009 to 2021, one for each column.
- The first three columns include:
- Blue Economy Sector
- Sub-Sector
- Activity
- The next 13 columns display the number of persons employed in each activity for each year from 2009 to 2021. Each cell in these columns contains numerical data representing the employment figures for that specific activity and year.
- The last row (row 44) the last row of the table summarises the total number of persons employed for each year, providing a clear overview of employment trends across the entire Blue Economy.
Overall, this table encompasses 7 sectors, 13 sub-sectors, and 42 activities, making it a valuable resource for analysing how employment in Blue Economy has evolved over the specified period in the specific country.
Figure 4: Greece: Evolution of the GVA by Blue Economy Activity (2009-2021) - M€"
This figure provides a comprehensive overview of the Gross Value Added (GVA) across various activities within the Blue Economy. It consists of 44 rows and 16 columns with the first row serving as the header that outlines the content of each column, namely: the title followed by the years from 2009 to 2021, one for each column.
- The first three columns include:
- Blue Economy Sector
- Sub-Sector
- Activity
- The next 13 columns display the GVA values for each activity from 2009 to 2021.
- The last row (row 44) summarises the totals for each year.
The table encompasses 7 sectors, 13 sub-sectors, and 42 activities, allowing for a detailed analysis of how the GVA has evolved over the specified years. This structured format facilitates comparisons across different sectors and activities, highlighting trends and changes within the Blue Economy in Greece.