The established Blue Economy sectors in Italy directly employ more than 400 thousand people and generate approx. €18.2 billion in GVA (2021). While representing a moderate share of the national economy, the Italian Blue Economy sectors contribute by approx. 1.1% to national GVA and 1.8% to national employment.
The relative size and share of the Blue Economy in Italy has been fluctuating since 2009 in terms of employment. Between 2009 and 2014, its workforce decreased from more than 610 thousand jobs in 2013 (representing about 2.7% of national employment) to less than 400 thousand in 2014 (1.8% of national employment). Since then, it has increased gradually up to a level of 509 thousand people in 2018 and 2019 (2.2%). The COVID-19 pandemic hit the country’s Blue Economy particularly hard, with a 30% contraction in its workforce between 2019 and 2020. Only less than one third of these jobs were regained in 2021.

In terms of GVA, Italy’s pre-pandemic Blue Economy was fluctuating in nominal terms between €17 billion (the lowest level registered in 2013) and €23.7 billion, the peak reached in 2019 (representing 1.5% of the GVA of the national economy). The impact of the health crisis was amongst the largest in the EU, with a 45% contraction down to €13.1 billion in 2020. Approximately half of this loss was recovered in 2021.
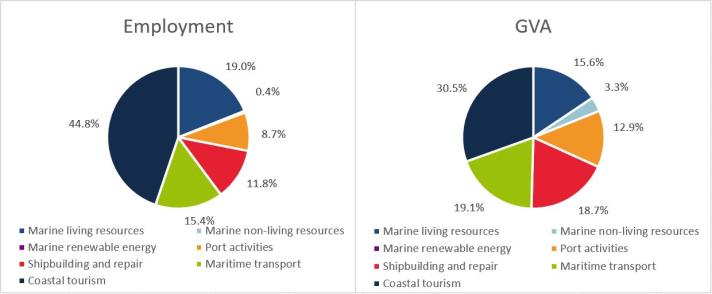
The largest Blue Economy sector in Italy is Coastal tourism, a sector that is particularly vulnerable to shocks such as those generated by COVID-19 and the subsequent energy crisis. The sector contributes to more than 30% to the country’s Blue Economy GVA and nearly half of its workforce. The second largest Blue Economy sector in Italy in terms of GVA is Maritime transport, representing 19% of total Blue Economy GVA and 15% of its employment. Shipbuilding and repair contributes another 19% to the country’s Blue Economy GVA, and 12% to its workforce. The Marine living resources sector is the second largest in terms of Blue Economy employment, with a share of 19% of its workforce.
In the EU, Italy ranks 2nd in employment for the Marine living resources and Maritime transport sectors; 3rd in GVA for Coastal tourism and Shipbuilding and repair; 5th in GVA and 6th in employment in Port activities.

Text description of images at the bottom of the page
Italy's coastline spans 9 136 km, making up 8.75 % of the total EU coastline. Five Italian seaports feature in the top 30 ports in Europe in terms of gross weight of goods handled (2021 data): Trieste (8th), Genoa (13th), Livorno (22nd), Ravenna (24th), and Venice (30th). Other large container ports are the ports of Gioia Tauro, Cagliari (known as Sarroch - Porto Foxi), Augusta, Taranto, Milazzo, Naples. In total, Italian container ports handle more than 490 million Tonnes of cargo per year. In terms of fisheries activity, the main ports are Mazara del Vallo, Trapani, Palermo, Chioggia, Ancona, Molfetta and Manfredonia.
In terms of passengers, Italy has the two largest ports in the EU (Messina and Reggio di Calabria), which serve as gateways between Sicily and continental Italy (serving more than 8 million passengers/year each). Other large passenger ports in Italy are the ports of Naples (7th in the EU), Piombino, Isola d’Elba, Livorno, Capri, Ischia, Genova, Trapani, Civitavecchia, and Palermo.

Several organizations are monitoring the Italian Blue Economy at the national level, as illustrated below:
Unioncamere - the Italian Union of Chambers of Commerce - publishes annual reports and studies on the Italian “economy of the sea”. These reports aim to analyze the potential of the Italian maritime economy and provide valuable information for policymakers, businesses, and researchers.
SRM Research Center is an Italian research institute that focuses on maritime economics and the blue economy. It publishes reports, studies, and analyses on various aspects of the Italian economy of the sea, including maritime transport, port activities, coastal development, fisheries, aquaculture, and marine renewable energy.
The Blue Forum Italia Network promotes collaboration, knowledge sharing, policy coherence, conflict prevention and resolution and empowerment and contributes to promoting the use and sustainable management of the sea for the benefit of the various maritime stakeholders and coastal communities.
Other national sources of information on the Italian Blue Economy are:
- Ministry of Agricultural, Food and Forestry Policies.
- National Institute for Environmental Protection and Research (ISPRA).
- Unioncamere’s marine economy observatory.
- OsserMare Blue Forum Italian Network.
- Italian Institutes for Marine Research (CNR-ISMAR, CNR-IAC and CNR-IRBIM).
- Institute of Marine Engineering (CNR-INM)
For more national level data, please visit the Dashboards section within the EU Blue Economy Observatory, where you can also find information about Educational and Employment opportunities in the Blue Economy sectors.
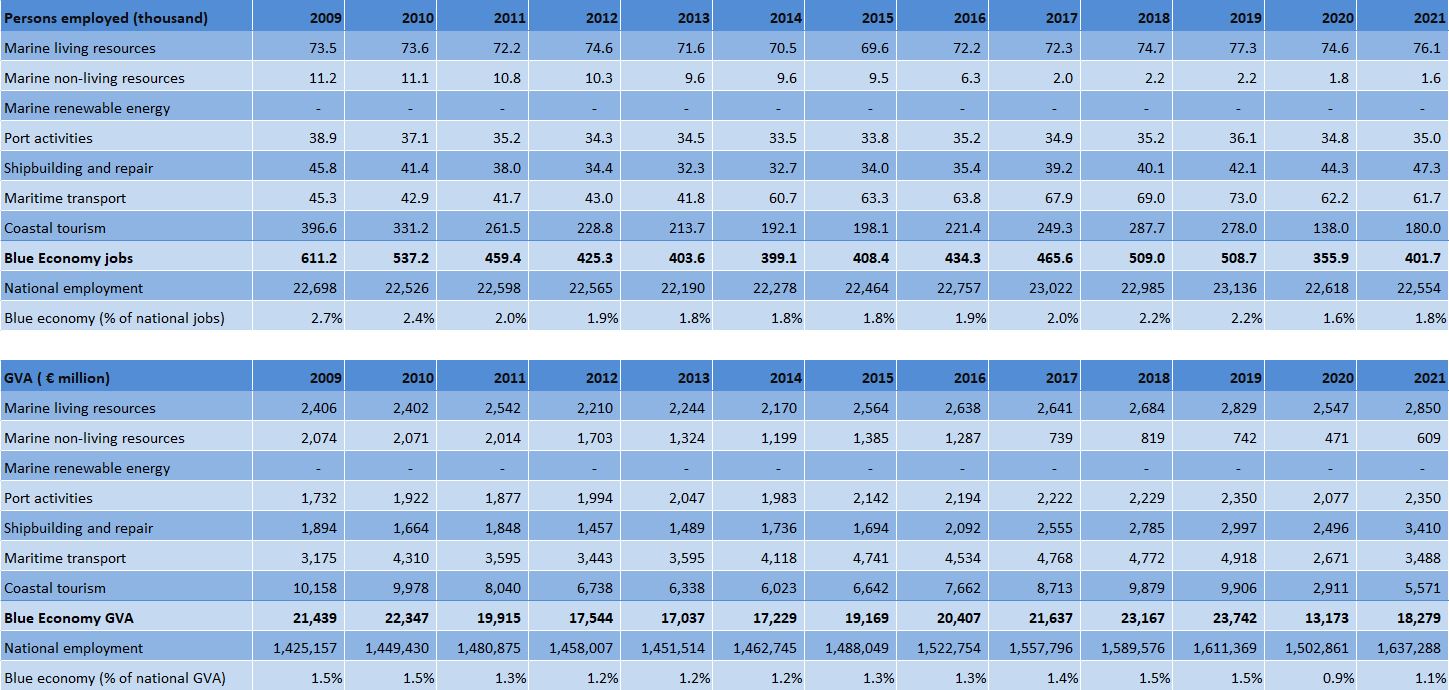
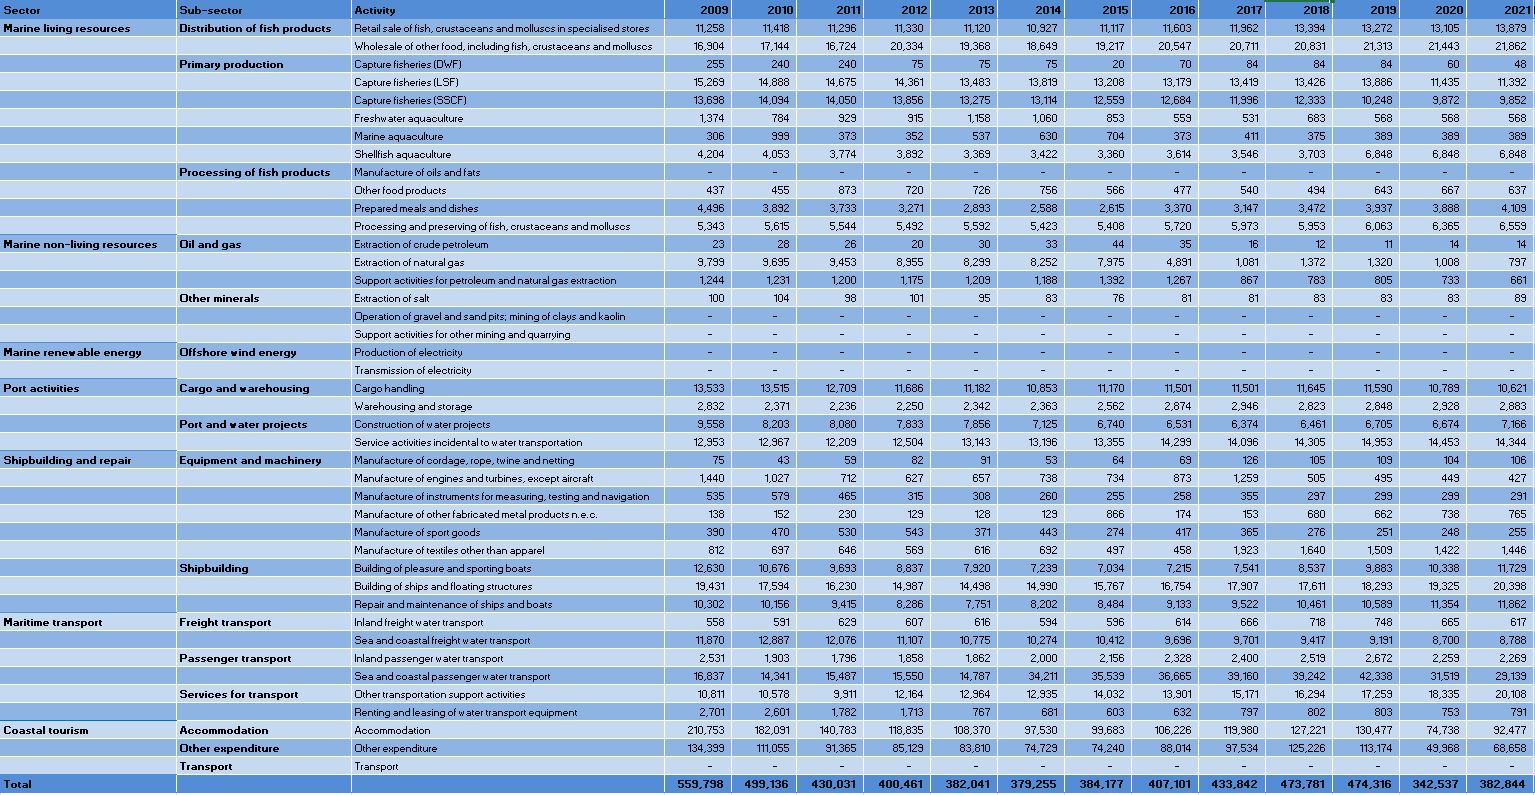
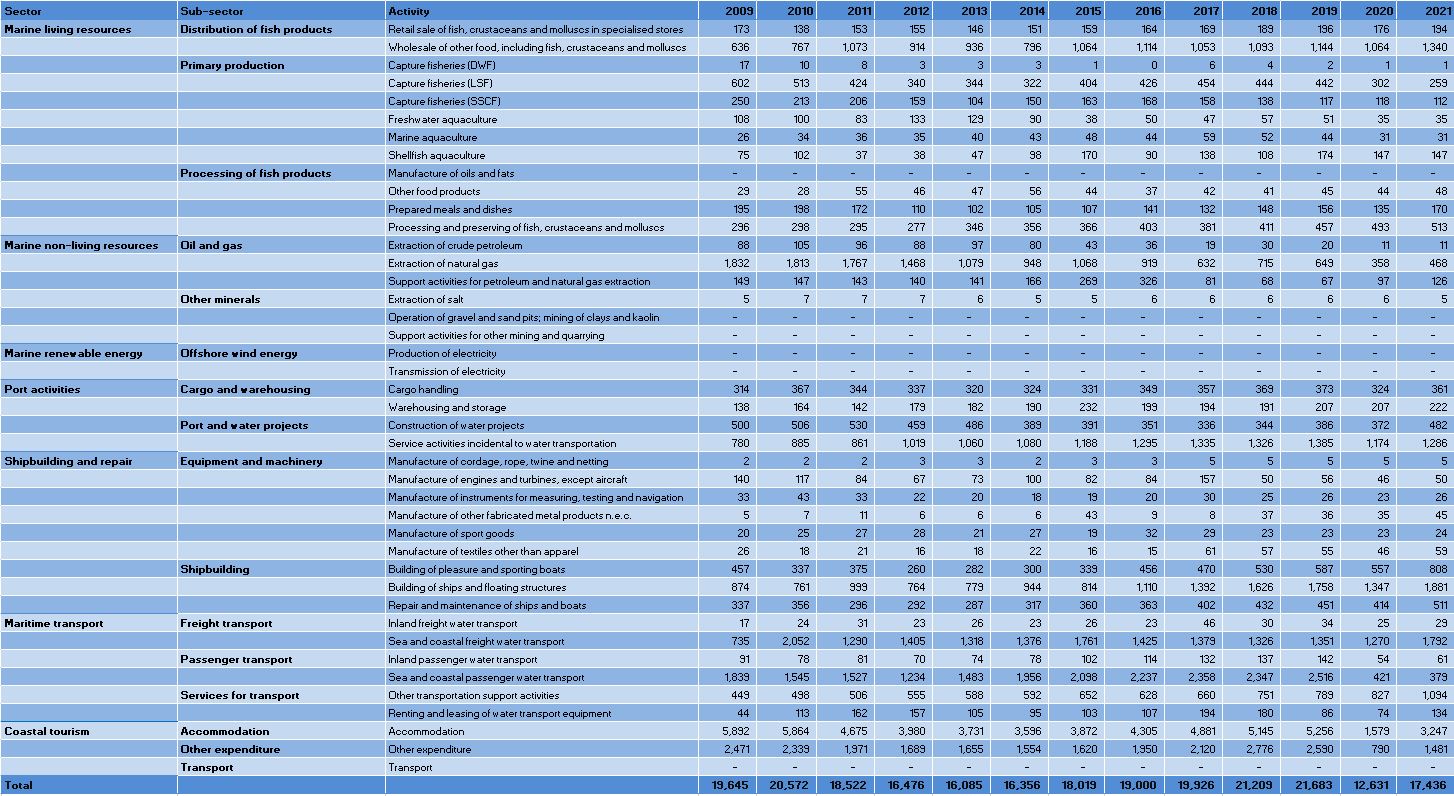
Figure 1: Italy: Evolution of the Blue Economy Established Sectors (2021)
This figure consists of two pie charts that illustrate key aspects of Italy's Blue Economy in 2021.
- Left Pie Chart: This chart represents the percentage of employment across various established sectors within the Blue Economy. Each sector is depicted as a segment of the pie, with the size of each segment corresponding to its share of total employment. For example, if the segment for "Coastal Tourism" occupies a larger portion, it indicates a higher percentage of employment in that sector compared to others.
- Right Pie Chart: This chart shows the percentage of Gross Value Added (GVA) for each established sector. Similar to the left chart, each segment reflects the contribution of that sector to the overall GVA of the Blue Economy. A larger segment signifies a greater economic impact from that sector.
Together, these charts provide a visual representation of both employment distribution and economic contribution within Italy's Blue Economy, highlighting the sectors that play significant roles in both areas.
Figure 2: Italy: Evolution of the Blue Economy established sectors (2009-2021)
This figure consists of two tables that illustrate the evolution of established sectors within the Blue Economy in Italy from 2009 to 2021.
First table:
- Structure: The first table has 11 rows and 14 columns.
- Column Overview:
- First Column: Lists the established sectors of the Blue Economy, from row 2 to row 10.
- Columns 2 to 14: Display the number of persons employed (in thousands) for each year from 2009 to 2021.
- First Row: Contains the headers, namely: the title followed by the years from 2009 to 2021, one for each column.
- Last Row: Contains the percentage of national jobs attributed to each sector for each year.
- Structure: The second table mirrors the first, also containing 11 rows and 14 columns.
Second table:
- Column Overview:
- First Column: Again lists the established sectors of the Blue Economy, from row 2 to row 10.
- Columns 2 to 14: Present the Gross Value Added (GVA) for each year (in million euros, M€) from 2009 to 2021.
- First Row: Contains the headers, namely: the title followed by the years from 2009 to 2021, one for each column.
- Last Row: Displays the percentage of national GVA for each sector for each year.
Figure 3: Italy: Evolution of the Employment by Blue Economy Activity (2009-2021) - Persons employed
This table provides a comprehensive overview of employment trends in Italy's Blue Economy from 2009 to 2021. It consists of 44 rows and 16 columns, with the first row serving as the header that outlines the content of each column, namely: the title followed by the years from 2009 to 2021, one for each column.
- The first three columns include:
- Blue Economy Sector
- Sub-Sector
- Activity
- The next 13 columns display the number of persons employed in each activity for each year from 2009 to 2021. Each cell in these columns contains numerical data representing the employment figures for that specific activity and year.
- The last row (row 44) the last row of the table summarises the total number of persons employed for each year, providing a clear overview of employment trends across the entire Blue Economy.
Overall, this table encompasses 7 sectors, 13 sub-sectors, and 42 activities, making it a valuable resource for analysing how employment in Blue Economy has evolved over the specified period in the specific country.
Figure 4: Italy: Evolution of the GVA by Blue Economy Activity (2009-2021) - M€"
This figure provides a comprehensive overview of the Gross Value Added (GVA) across various activities within the Blue Economy. It consists of 44 rows and 16 columns with the first row serving as the header that outlines the content of each column, namely: the title followed by the years from 2009 to 2021, one for each column.
- The first three columns include:
- Blue Economy Sector
- Sub-Sector
- Activity
- The next 13 columns display the GVA values for each activity from 2009 to 2021.
- The last row (row 44) summarises the totals for each year.
The table encompasses 7 sectors, 13 sub-sectors, and 42 activities, allowing for a detailed analysis of how the GVA has evolved over the specified years. This structured format facilitates comparisons across different sectors and activities, highlighting trends and changes within the Blue Economy in Italy.