The established Blue Economy sectors in Latvia directly employ nearly 20 thousand people and generate approx. €410 million in GVA (2021). The Latvian Blue Economy sectors represent a moderate share of the national economy, contributing by approx. 1.4% to national GVA and 2.3% to national employment.
The size and share of the Blue Economy in Latvia has been fluctuating since 2009 in terms of employment, reaching its highest level in 2013 (44 thousand employees). The COVID-19 pandemic hit the country’s Blue Economy particularly hard, with a 43% contraction in its workforce between 2019 and 2020. More than one thousand jobs were lost in the following year.

Similarly, Latvia’s Blue Economy GVA fluctuated in nominal terms between €372 million in 2010 and the peak of €659 million registered in 2019. Then, it suffered from a 39% contraction in 2020, prior to a modest 2% recovery in 2021.
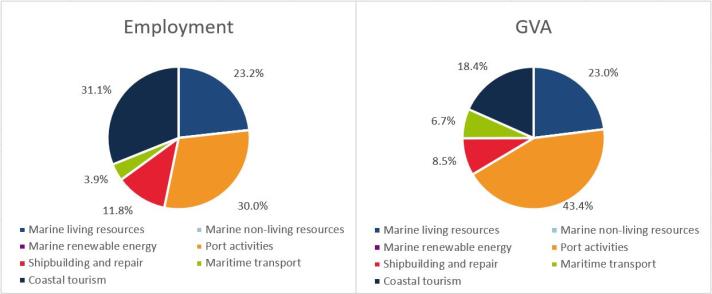
The largest Blue Economy sector in Latvia is Port activities, contributing to more than 43% to the country’s Blue Economy GVA and 30% to its workforce. The second largest Blue Economy sector in terms of GVA is Marine living resources, representing 23% of total Blue Economy GVA and 23% of its employment. However, Coastal tourism is the sector that provides the highest contribution to the country’s Blue Economy employment, with a share of 31% of its workforce.

Text description of images at the bottom of the page
Latvia has 494 km of coastline along the Baltic sea. Latvia has three major seaports and seven smaller ports. Riga is the biggest port in Latvia and second biggest in the Baltic States. It handles a significant amount of containerized cargo, with an annual throughput of over 600,000 TEUs (twenty-foot equivalent units), or approx. 19 million Tonnes/year (2023). The port of Ventspils is one of the leading deep-water ports of the EU on the East coast of the Baltic Sea, servicing the largest vessels entering the Baltic Sea throughout the whole year, handling another 10 million Tonnes/year. Liepaja is the third biggest port (6.5 million Tonnes). Fishing vessels use also small ports like Skulte, Mersrags, Salacgriva, Pavilosta, Roja and Engure.
The largest passenger port in Latvia is the Free Port of Riga, which serves as a major hub for passenger transportation, including cruise ships and ferry services to and from various destinations in the Baltic Sea region. Additionally, the Port of Ventspils also serves as a key passenger port, especially during the summer months when it caters to tourists and travelers visiting the Latvian coast (approx. 200 thousand passengers/year).

The Latvian Institute of Aquatic Ecology is an agency of Daugavpils University and an internationally competitive scientific institute conducting academic and applied research in aquatic ecology. Among other objectives, the Institute aims to develop the knowledge base on ecosystem services and their values and stimulate the integration of this knowledge into planning and decision-making for sustainable ecosystem management in the Baltic Sea.
Other national sources of information on the Latvian Blue Economy are:
- Latvian Ministry of Environmental Protection and Regional Development.
- Latvian Ministry of Agriculture.
- Freeport Authority of Riga.
- Latvian Institute of Food Safety, Animal Health and Environment (BIOR).
For more national level data, please visit the Dashboards section within the EU Blue Economy Observatory, where you can also find information about Educational and Employment opportunities in the Blue Economy sectors.
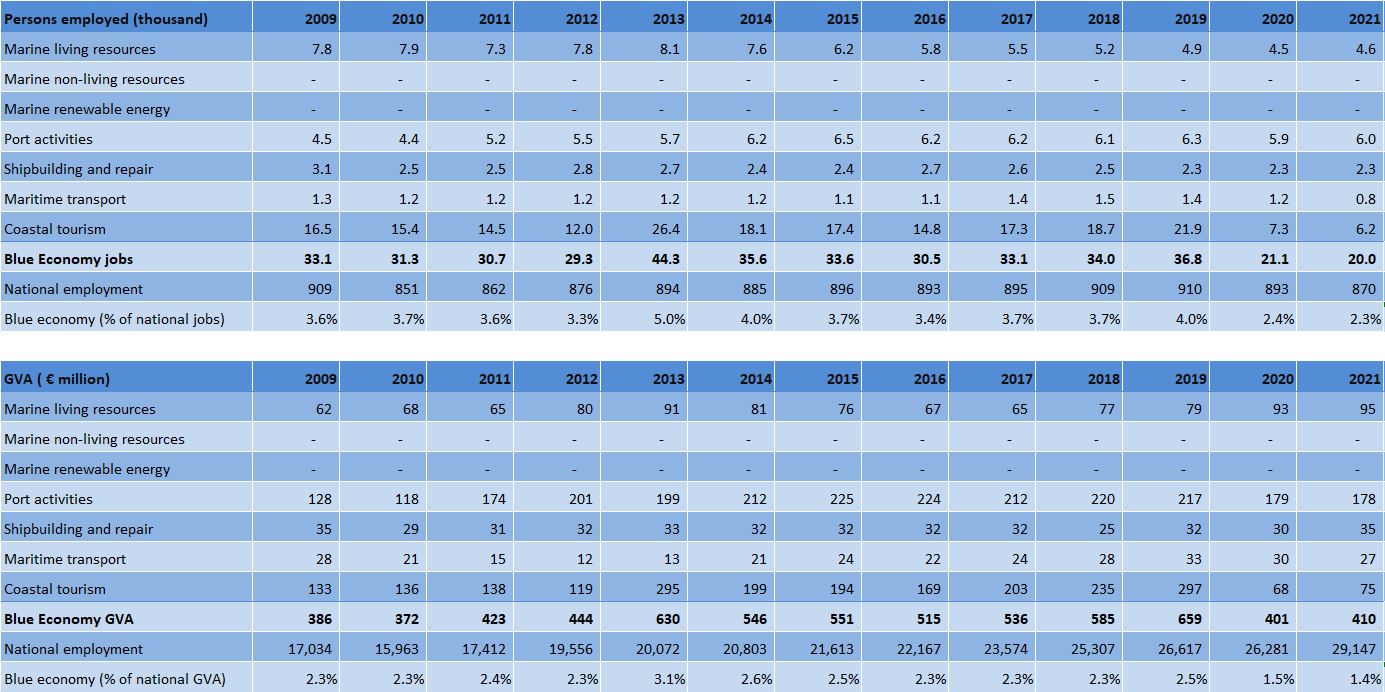
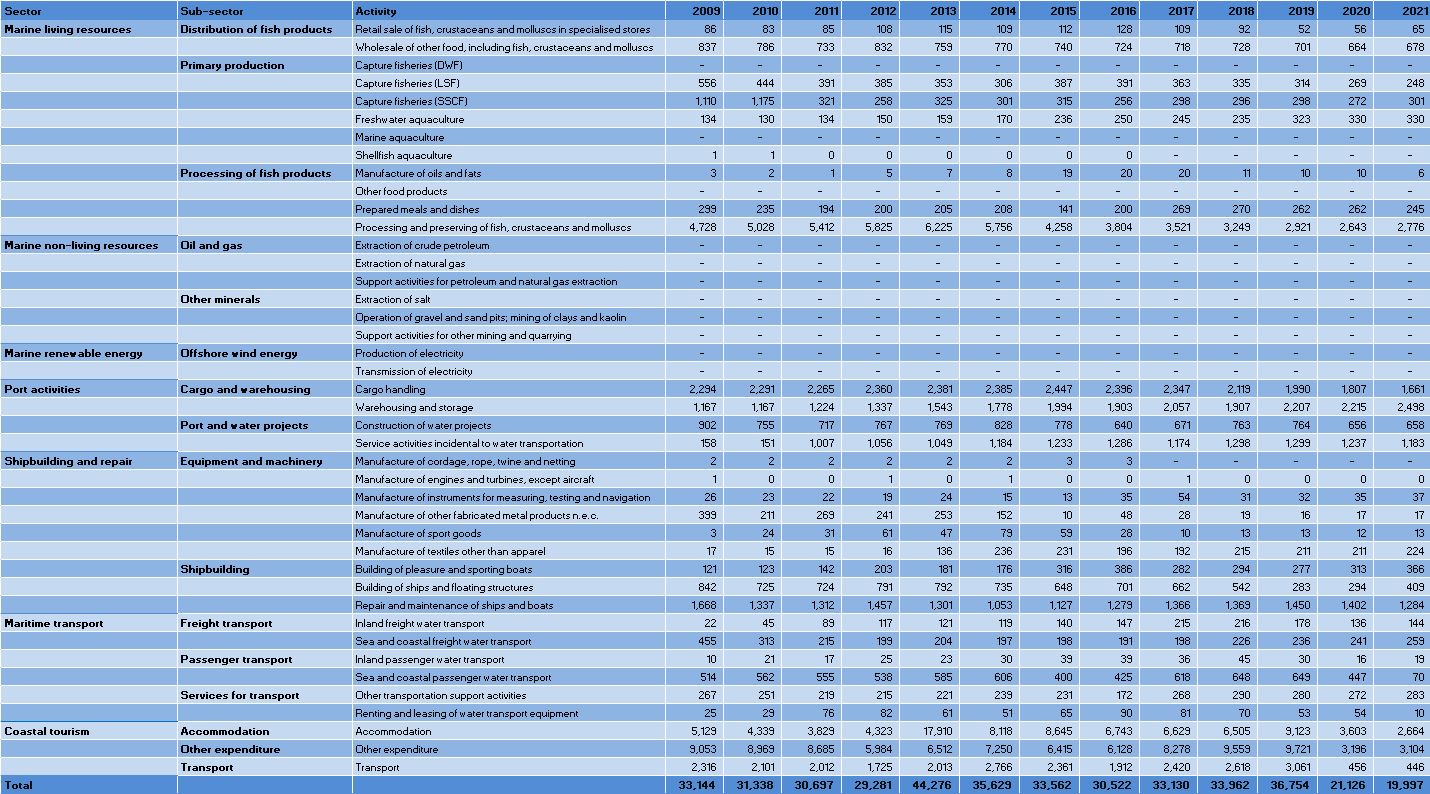
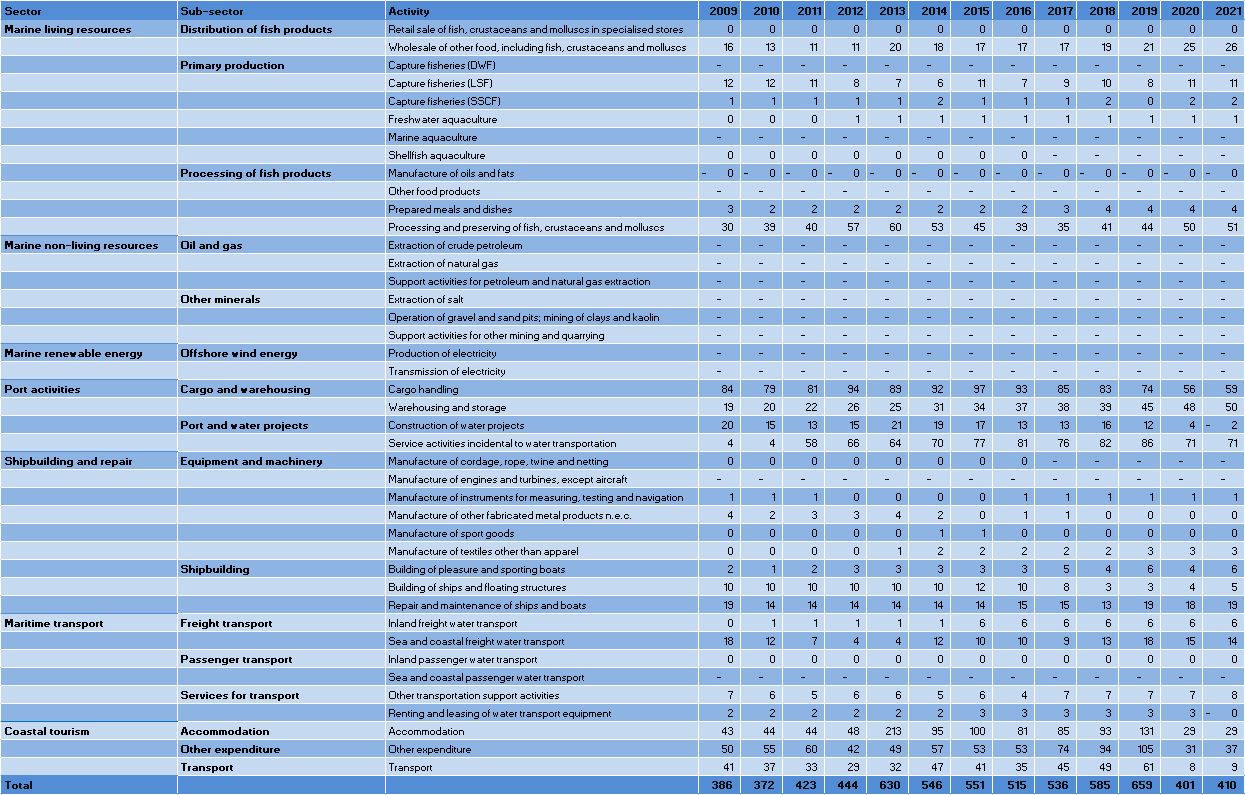
Figure 1: Latvia: Evolution of the Blue Economy Established Sectors (2021)
This figure consists of two pie charts that illustrate key aspects of Latvia's Blue Economy in 2021.
- Left Pie Chart: This chart represents the percentage of employment across various established sectors within the Blue Economy. Each sector is depicted as a segment of the pie, with the size of each segment corresponding to its share of total employment. For example, if the segment for "Coastal Tourism" occupies a larger portion, it indicates a higher percentage of employment in that sector compared to others.
- Right Pie Chart: This chart shows the percentage of Gross Value Added (GVA) for each established sector. Similar to the left chart, each segment reflects the contribution of that sector to the overall GVA of the Blue Economy. A larger segment signifies a greater economic impact from that sector.
Together, these charts provide a visual representation of both employment distribution and economic contribution within Latvia's Blue Economy, highlighting the sectors that play significant roles in both areas.
Figure 2: Latvia: Evolution of the Blue Economy established sectors (2009-2021)
This figure consists of two tables that illustrate the evolution of established sectors within the Blue Economy in Latvia from 2009 to 2021.
First table:
- Structure: The first table has 11 rows and 14 columns.
- Column Overview:
- First Column: Lists the established sectors of the Blue Economy, from row 2 to row 10.
- Columns 2 to 14: Display the number of persons employed (in thousands) for each year from 2009 to 2021.
- First Row: Contains the headers, namely: the title followed by the years from 2009 to 2021, one for each column.
- Last Row: Contains the percentage of national jobs attributed to each sector for each year.
- Structure: The second table mirrors the first, also containing 11 rows and 14 columns.
Second table:
- Column Overview:
- First Column: Again lists the established sectors of the Blue Economy, from row 2 to row 10.
- Columns 2 to 14: Present the Gross Value Added (GVA) for each year (in million euros, M€) from 2009 to 2021.
- First Row: Contains the headers, namely: the title followed by the years from 2009 to 2021, one for each column.
- Last Row: Displays the percentage of national GVA for each sector for each year.
Figure 3: Latvia: Evolution of the Employment by Blue Economy Activity (2009-2021) - Persons employed
This table provides a comprehensive overview of employment trends in Latvia's Blue Economy from 2009 to 2021. It consists of 44 rows and 16 columns, with the first row serving as the header that outlines the content of each column, namely: the title followed by the years from 2009 to 2021, one for each column.
- The first three columns include:
- Blue Economy Sector
- Sub-Sector
- Activity
- The next 13 columns display the number of persons employed in each activity for each year from 2009 to 2021. Each cell in these columns contains numerical data representing the employment figures for that specific activity and year.
- The last row (row 44) the last row of the table summarises the total number of persons employed for each year, providing a clear overview of employment trends across the entire Blue Economy.
Overall, this table encompasses 7 sectors, 13 sub-sectors, and 42 activities, making it a valuable resource for analysing how employment in Blue Economy has evolved over the specified period in the specific country.
Figure 4: Latvia: Evolution of the GVA by Blue Economy Activity (2009-2021) - M€"
This figure provides a comprehensive overview of the Gross Value Added (GVA) across various activities within the Blue Economy. It consists of 44 rows and 16 columns with the first row serving as the header that outlines the content of each column, namely: the title followed by the years from 2009 to 2021, one for each column.
- The first three columns include:
- Blue Economy Sector
- Sub-Sector
- Activity
- The next 13 columns display the GVA values for each activity from 2009 to 2021.
- The last row (row 44) summarises the totals for each year.
The table encompasses 7 sectors, 13 sub-sectors, and 42 activities, allowing for a detailed analysis of how the GVA has evolved over the specified years. This structured format facilitates comparisons across different sectors and activities, highlighting trends and changes within the Blue Economy in Latvia.