The established Blue Economy sectors in Poland directly employ more than 158 thousand people and generate approximately €3.6 billion in GVA (2021). The Polish Blue Economy represents a relatively small proportion of the national economy, contributing by approx. 1% to national employment and by 0.7% to national GVA.
The relative size and share of the Blue Economy has remained stable in Poland since 2009. However, in absolute terms the number of people employed in the Blue Economy showed a 52% increase from 104 thousand, the lowest level registered in 2011. This brought the contribution to national employment to raise from 0.7% in 2011 to 1% in 2021.

Similarly, in absolute terms, the contribution of the Blue Economy to the national GVA in Poland increased by €1.4 billion over the last decade, from a level of approx. €2.2 billion registered in the 2009-1011 period. The Blue Economy was more resilient to the COVID-19 pandemic than in other EU countries, as it suffered a loss of €114 million (-3%) between 2019 and 2020. The national Blue Economy has fully recovered since, as testified by a 13% increase in GVA between 2020 and 2021.
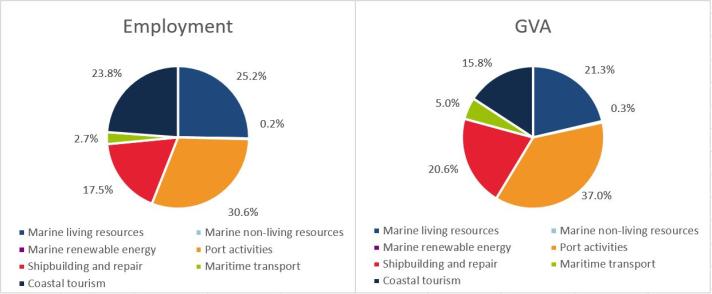
The largest Blue Economy sector in Poland is Port activities, which contributed to the Polish Blue Economy by 37% in terms of GVA and almost 31% in terms of employment. The second largest Blue Economy sector of the country is Marine living resources, contributing with 21% and 25% to GVA and employment, respectively. Next, is Shipbuilding and repair, contributing with another 21% to the national Blue Economy GVA and 17% to its employment. Coastal tourism represents 16% of the national Blue Economy GVA but employs nearly a fourth of its workforce (24%).

Text description of images at the bottom of the page
In the EU, Poland ranks 4th in employment and 6th in GVA for Shipbuilding and repair; 5th in employment and 8th in GVA for Marine living resources; and 6th in employment and 9th in GVA for Marine non-Living resources.
The largest container seaport in Poland is the port of Gdansk, which is one of the largest in the Baltic Sea region and the 16th largest cargo port in the EU, handling more than 45 million Tonnes in 2021. Other important seaports include the ports of Gdynia, Swinoujscie, and Szczecin (this latter located at about 68km from the coastline in the Lower Oder Valley), handling nearly 49 million Tonnes in total.
The abovementioned ports are also the largest in Poland for passenger traffic, particularly for ferries and cruise ships, receiving approximately 1.8 million passengers per year.

Several organizations are monitoring the Polish Blue Economy at the national level, as illustrated below:
The Maritime Institute in Gdańsk (Instytut Morski w Gdańsku) is a research and development unit supervised by Ministry of Maritime Economy. For over fifty years the Institute has been closely associated with maritime economy. The Institute conducts research work, scientific and implementation projects, studies and assessments. Its mission is to take care and preserve the values of the sea and sustainable development of the Polish maritime economy.
The National Marine Fisheries Research Institute (NMFRI) is the oldest marine science centre in Poland. Its mission is to provide independent, objective and up-to-date knowledge based on scientific activity as well as research and development works, which support economically sustainable and environmentally sound development of marine fisheries.
- Other sources of information on the Polish Blue Economy are:
- Ministry of Maritime Economy and Inland Navigation (Ministerstwo Gospodarki Morskiej i Żeglugi Śródlądowej).
- Institute of Oceanology Polish Academy of Sciences (Instytut Oceanologii Polskiej Akademii Nauk).
- Polish Geological Institute - National Research Institut (PGI-NRI, Państwowy Instytut Geologiczny - Państwowy Instytut Badawczy).
For more national level data, please visit the Dashboards section within the EU Blue Economy Observatory, where you can also find information about Educational and Employment opportunities in the Blue Economy sectors.
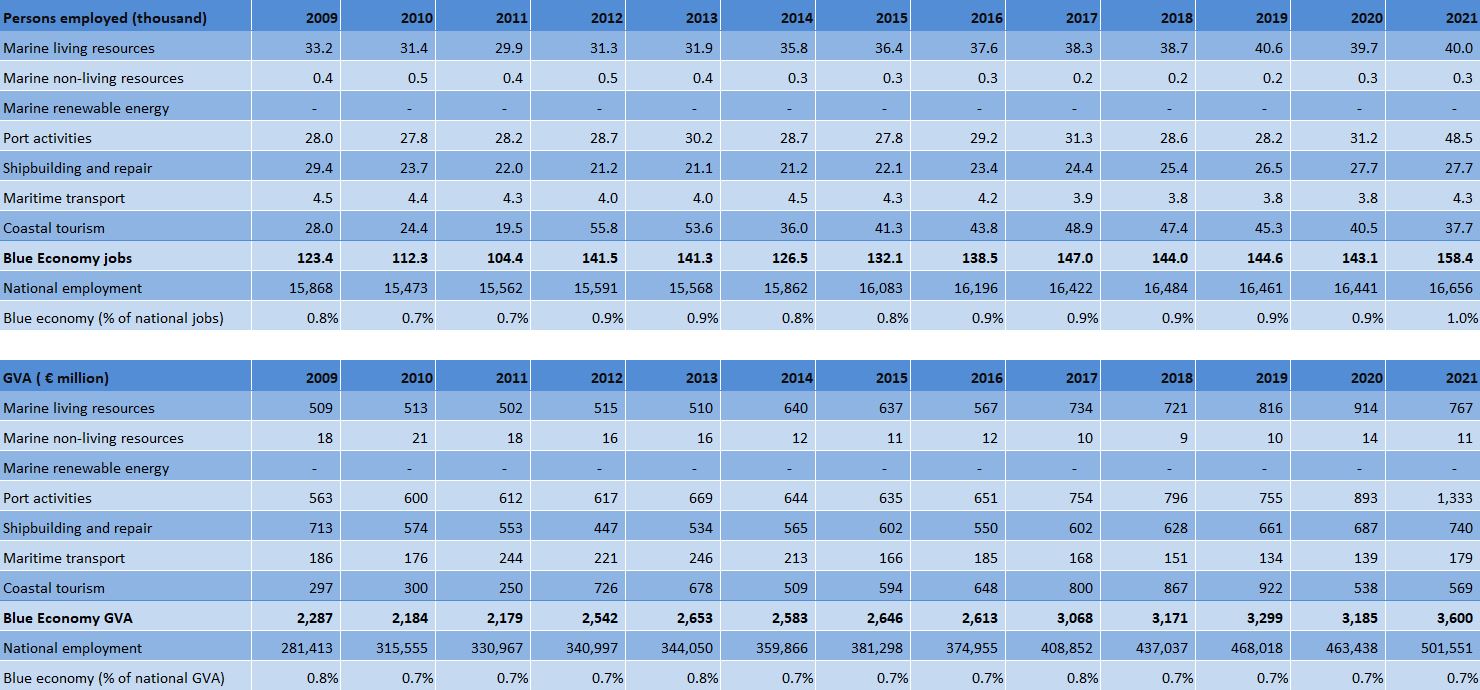

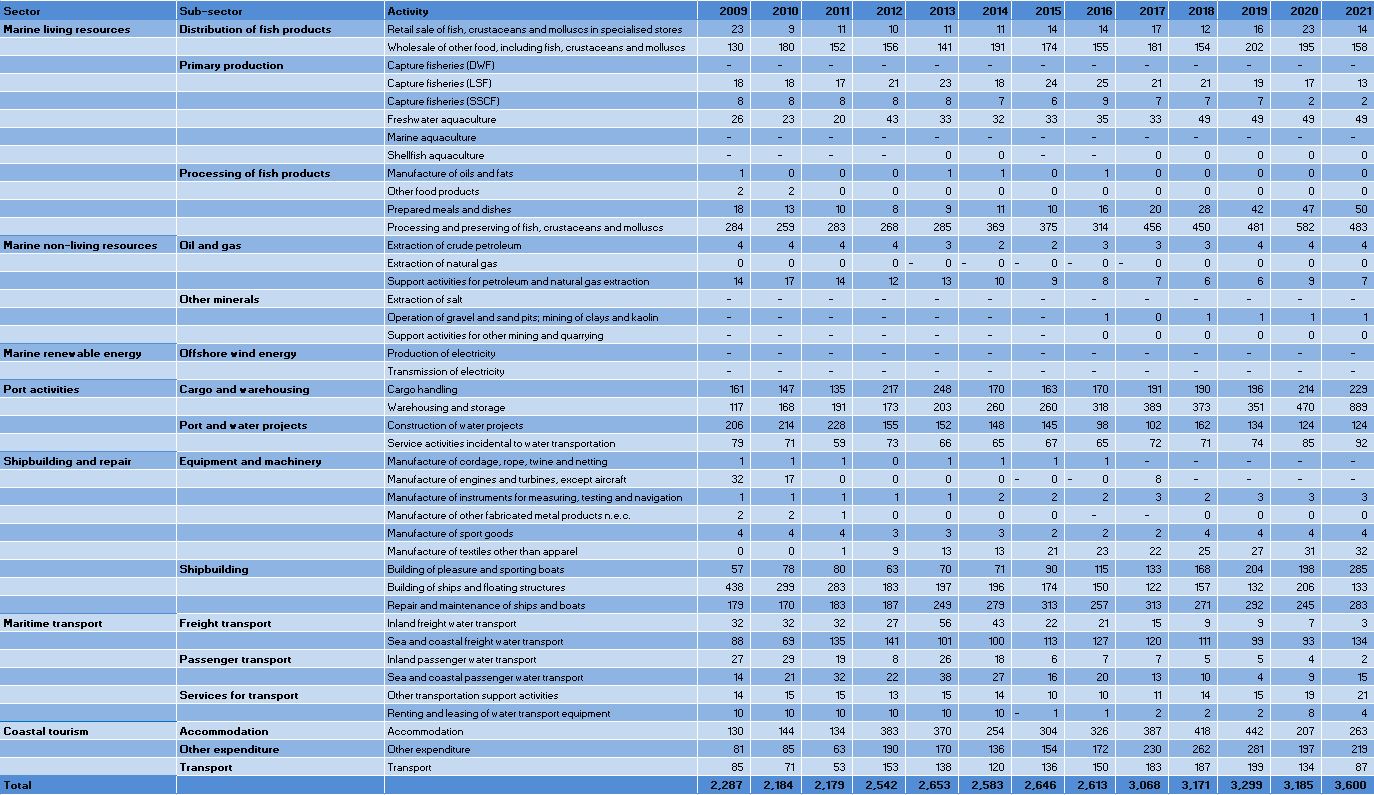
Figure 1: Poland: Evolution of the Blue Economy Established Sectors (2021)
This figure consists of two pie charts that illustrate key aspects of Poland Blue Economy in 2021.
- Left Pie Chart: This chart represents the percentage of employment across various established sectors within the Blue Economy. Each sector is depicted as a segment of the pie, with the size of each segment corresponding to its share of total employment. For example, if the segment for "Coastal Tourism" occupies a larger portion, it indicates a higher percentage of employment in that sector compared to others.
- Right Pie Chart: This chart shows the percentage of Gross Value Added (GVA) for each established sector. Similar to the left chart, each segment reflects the contribution of that sector to the overall GVA of the Blue Economy. A larger segment signifies a greater economic impact from that sector.
Together, these charts provide a visual representation of both employment distribution and economic contribution within Poland Blue Economy, highlighting the sectors that play significant roles in both areas.
Figure 2: Poland: Evolution of the Blue Economy established sectors (2009-2021)
This figure consists of two tables that illustrate the evolution of established sectors within the Blue Economy in Poland from 2009 to 2021.
First table:
- Structure: The first table has 11 rows and 14 columns.
- Column Overview:
- First Column: Lists the established sectors of the Blue Economy, from row 2 to row 10.
- Columns 2 to 14: Display the number of persons employed (in thousands) for each year from 2009 to 2021.
- First Row: Contains the headers, namely: the title followed by the years from 2009 to 2021, one for each column.
- Last Row: Contains the percentage of national jobs attributed to each sector for each year.
- Structure: The second table mirrors the first, also containing 11 rows and 14 columns.
Second table:
- Column Overview:
- First Column: Again lists the established sectors of the Blue Economy, from row 2 to row 10.
- Columns 2 to 14: Present the Gross Value Added (GVA) for each year (in million euros, M€) from 2009 to 2021.
- First Row: Contains the headers, namely: the title followed by the years from 2009 to 2021, one for each column.
- Last Row: Displays the percentage of national GVA for each sector for each year.
Figure 3: Poland: Evolution of the Employment by Blue Economy Activity (2009-2021) - Persons employed
This table provides a comprehensive overview of employment trends in Poland Blue Economy from 2009 to 2021. It consists of 44 rows and 16 columns, with the first row serving as the header that outlines the content of each column, namely: the title followed by the years from 2009 to 2021, one for each column.
- The first three columns include:
- Blue Economy Sector
- Sub-Sector
- Activity
- The next 13 columns display the number of persons employed in each activity for each year from 2009 to 2021. Each cell in these columns contains numerical data representing the employment figures for that specific activity and year.
- The last row (row 44) the last row of the table summarises the total number of persons employed for each year, providing a clear overview of employment trends across the entire Blue Economy.
Overall, this table encompasses 7 sectors, 13 sub-sectors, and 42 activities, making it a valuable resource for analysing how employment in Blue Economy has evolved over the specified period in the specific country.
Figure 4: Poland: Evolution of the GVA by Blue Economy Activity (2009-2021) - M€"
This figure provides a comprehensive overview of the Gross Value Added (GVA) across various activities within the Blue Economy. It consists of 44 rows and 16 columns with the first row serving as the header that outlines the content of each column, namely: the title followed by the years from 2009 to 2021, one for each column.
- The first three columns include:
- Blue Economy Sector
- Sub-Sector
- Activity
- The next 13 columns display the GVA values for each activity from 2009 to 2021.
- The last row (row 44) summarises the totals for each year.
The table encompasses 7 sectors, 13 sub-sectors, and 42 activities, allowing for a detailed analysis of how the GVA has evolved over the specified years. This structured format facilitates comparisons across different sectors and activities, highlighting trends and changes within the Blue Economy in Poland.