The Portuguese established Blue Economy sectors directly employ more than 152 800 people and generate approximately €3.3 billion in GVA (2021). The Blue Economy in Portugal contributes by approx. 1.8% to the national GVA and by 3.2% to national employment.
The relative share of the Blue Economy has been gradually increasing in Portugal since about a decade, until it was hit by the COVID-19 pandemic. In absolute terms, employment in the established Blue Economy sectors increased from 137 000 people in 2011 to a peak of 252 000 people in 2018. Approximately 93 000 jobs were lost between 2019 and 2020 as a consequence of the health crisis (-41%). However, a 15% increase was registered in 2021.

In terms of GVA, the Portuguese Blue Economy reached a peak of €5.7 billion in 2018, representing 3.2% of the national GVA. Then it dropped to €2.3 billion in 2020, mainly as a result of the COVID-19 pandemic given that 85% of the decrease in nominal terms was registered between 2019 and 2020. Since then, the national Blue Economy has embarked on a recovery path, testified by an increase in GVA of €1 billion registered in 2021.
Portugal has the third largest Exclusive Economic Zone (EEZ) in the EU after France (1st in the world) and Denmark (15th) and became the first EU Member State to prepare a Satellite Account for the Sea.
The Portuguese Blue Economy is dominated by Coastal tourism, which contributed to the Portuguese Blue Economy by nearly 71% in terms of employment and 59% in terms of GVA. The second largest Blue Economy sector in Portugal is Marine living resources, contributing with 22% and 23% to employment and GVA, respectively. This is followed by Port activities, contributing with 10% to the Portuguese Blue Economy GVA and 3% to its employment.


Text description of images at the bottom of the page
In the EU, Portugal ranks 6th in employment and 8th in GVA for Coastal tourism; 7th in employment and GVA for Marine living resources; and 9th in employment for Marine non-Living resources.
The largest container port in Portugal is the port of Sines, which is also the 17th largest cargo port in the EU, handling almost 43 million Tonnes in 2021. Other important seaports include the ports of Leixões (Porto), Lisbon, Setúbal and Aveiro, handling approximately another 34 million Tonnes in total.
The largest passenger ports in Portugal are primarily located in major coastal cities and serve as key hubs for domestic and international maritime travel. The port of Horta in the Azores is the largest port with 385 000 passengers per year, followed by the ports of Funchal and Porto Santo in Madeira (517 000 in total).
Several organizations are monitoring the Portuguese Blue Economy at the national level, as illustrated below:
The Oceano Azul Foundation, a Portuguese non-profit organization dedicated to the conservation and sustainable use of the ocean, publishes a wide range of content related to the Portuguese blue economy. This includes reports, studies, and articles focusing on marine conservation, sustainable fisheries, aquaculture, marine technology, ocean governance, and maritime tourism. The foundation also shares information on its initiatives, projects, and partnerships aimed at promoting a healthy and thriving blue economy in Portugal.
The Portuguese Institute for the Ocean and Atmosphere (Instituto Português do Mar e da Atmosfera - IPMA) conducts scientific research and publishes reports, and publications on oceanography, marine ecosystems, maritime resources, and environmental issues impacting the blue economy. The institute also provides data, statistics, and assessments of marine and atmospheric conditions relevant to the sustainable use of marine resources, fisheries, aquaculture, and coastal management.
Other national sources of information on the Portuguese Blue Economy are:
For more national level data, please visit the Dashboards section within the EU Blue Economy Observatory, where you can also find information about Educational and Employment opportunities in the Blue Economy sectors.


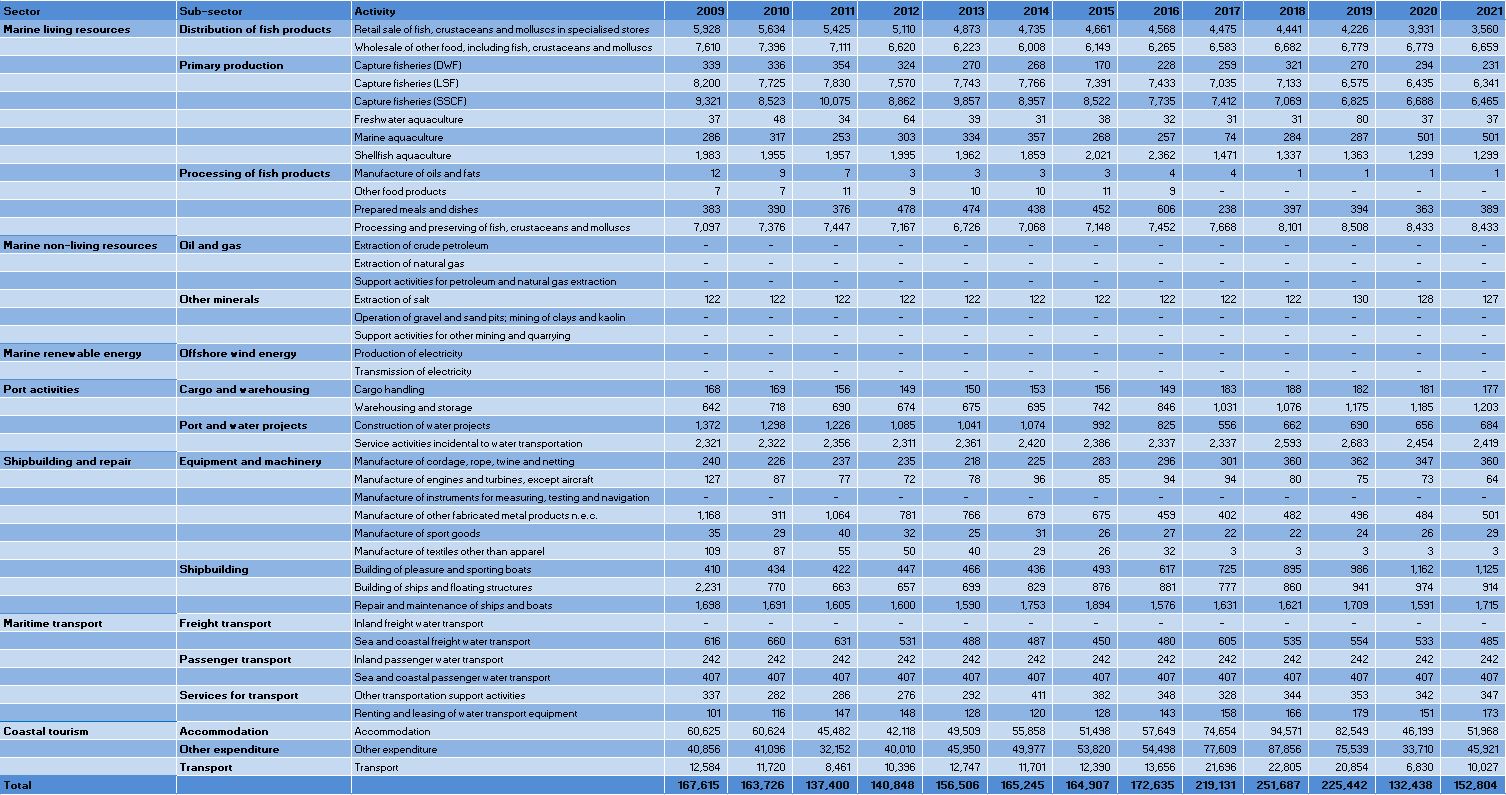
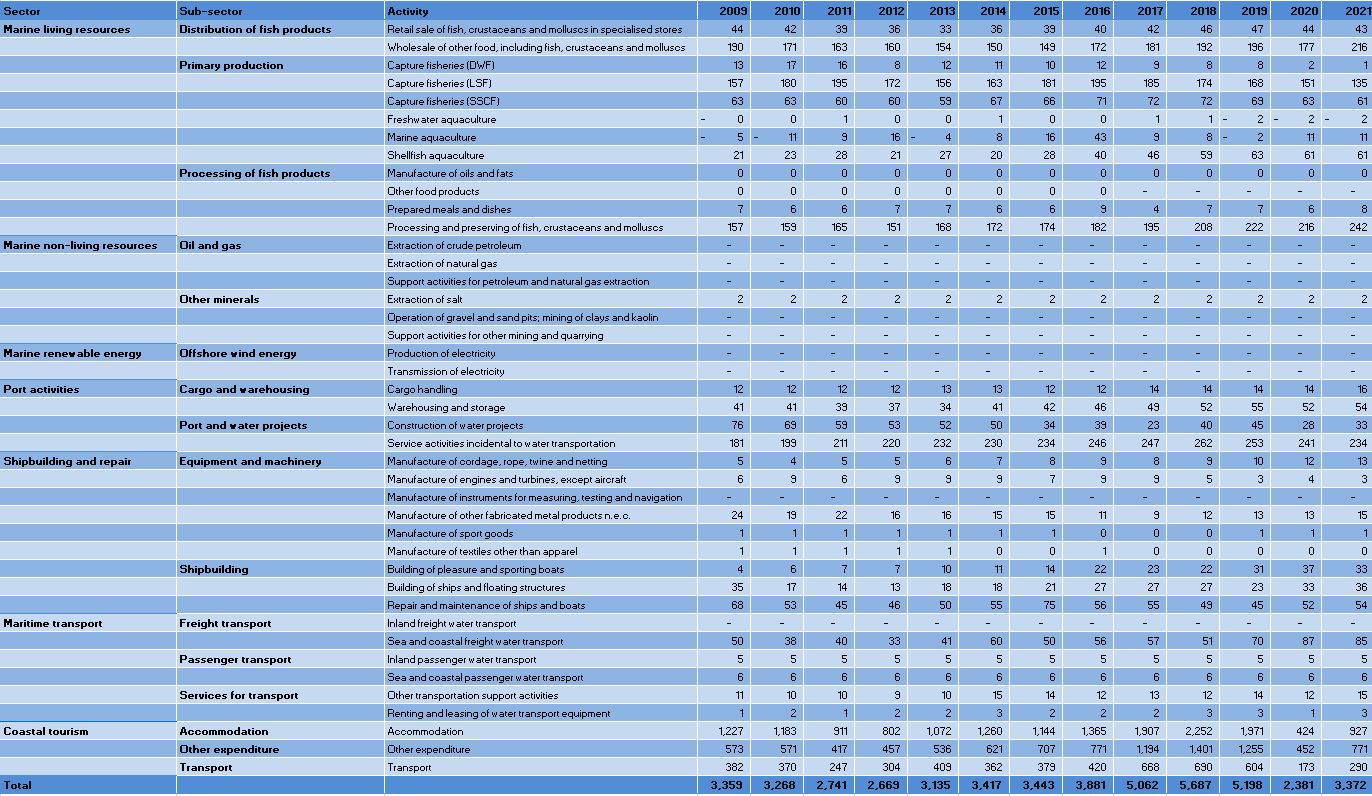
Figure 1: Portugal: Evolution of the Blue Economy Established Sectors (2021)
This figure consists of two pie charts that illustrate key aspects of Portugal’s Blue Economy in 2021.
- Left Pie Chart: This chart represents the percentage of employment across various established sectors within the Blue Economy. Each sector is depicted as a segment of the pie, with the size of each segment corresponding to its share of total employment. For example, if the segment for "Coastal Tourism" occupies a larger portion, it indicates a higher percentage of employment in that sector compared to others.
- Right Pie Chart: This chart shows the percentage of Gross Value Added (GVA) for each established sector. Similar to the left chart, each segment reflects the contribution of that sector to the overall GVA of the Blue Economy. A larger segment signifies a greater economic impact from that sector.
Together, these charts provide a visual representation of both employment distribution and economic contribution within Portugal’s Blue Economy, highlighting the sectors that play significant roles in both areas.
Figure 2: Portugal: Evolution of the Blue Economy established sectors (2009-2021)
This figure consists of two tables that illustrate the evolution of established sectors within the Blue Economy in Portugal from 2009 to 2021.
First table:
- Structure: The first table has 11 rows and 14 columns.
- Column Overview:
- First Column: Lists the established sectors of the Blue Economy, from row 2 to row 10.
- Columns 2 to 14: Display the number of persons employed (in thousands) for each year from 2009 to 2021.
- First Row: Contains the headers, namely: the title followed by the years from 2009 to 2021, one for each column.
- Last Row: Contains the percentage of national jobs attributed to each sector for each year.
- Structure: The second table mirrors the first, also containing 11 rows and 14 columns.
Second table:
- Column Overview:
- First Column: Again lists the established sectors of the Blue Economy, from row 2 to row 10.
- Columns 2 to 14: Present the Gross Value Added (GVA) for each year (in million euros, M€) from 2009 to 2021.
- First Row: Contains the headers, namely: the title followed by the years from 2009 to 2021, one for each column.
- Last Row: Displays the percentage of national GVA for each sector for each year.
Figure 3: Portugal: Evolution of the Employment by Blue Economy Activity (2009-2021) - Persons employed
This table provides a comprehensive overview of employment trends in Portugal’s Blue Economy from 2009 to 2021. It consists of 44 rows and 16 columns, with the first row serving as the header that outlines the content of each column, namely: the title followed by the years from 2009 to 2021, one for each column.
- The first three columns include:
- Blue Economy Sector
- Sub-Sector
- Activity
- The next 13 columns display the number of persons employed in each activity for each year from 2009 to 2021. Each cell in these columns contains numerical data representing the employment figures for that specific activity and year.
- The last row (row 44) the last row of the table summarises the total number of persons employed for each year, providing a clear overview of employment trends across the entire Blue Economy.
Overall, this table encompasses 7 sectors, 13 sub-sectors, and 42 activities, making it a valuable resource for analysing how employment in Blue Economy has evolved over the specified period in the specific country.
Figure 4: Portugal: Evolution of the GVA by Blue Economy Activity (2009-2021) - M€"
This figure provides a comprehensive overview of the Gross Value Added (GVA) across various activities within the Blue Economy. It consists of 44 rows and 16 columns with the first row serving as the header that outlines the content of each column, namely: the title followed by the years from 2009 to 2021, one for each column.
- The first three columns include:
- Blue Economy Sector
- Sub-Sector
- Activity
- The next 13 columns display the GVA values for each activity from 2009 to 2021.
- The last row (row 44) summarises the totals for each year.
The table encompasses 7 sectors, 13 sub-sectors, and 42 activities, allowing for a detailed analysis of how the GVA has evolved over the specified years. This structured format facilitates comparisons across different sectors and activities, highlighting trends and changes within the Blue Economy in Portugal.