The Spanish established Blue Economy sectors employ almost 625 300 people and generates around €21.3 billion in GVA. The Blue Economy has had a positive impact on the Spanish economy and employment rates.
In Spain, the share of Blue Economy GVA to the national economy increased until reaching 3.2%, its highest point in 2018. Then decreasing to 1.4% in 2020, mainly due to the COVID-19 pandemic and recovering since then, with 1.9% of the overall national GVA in 2021.
Similarly, the share of Blue Economy jobs to national employment increased until reaching 5.1%, its highest point in 2018. Then decreasing to 2.9% in 2020, mainly due to the COVID-19 pandemic and recovering since then, with 3.2% of the overall national GVA in 2021.

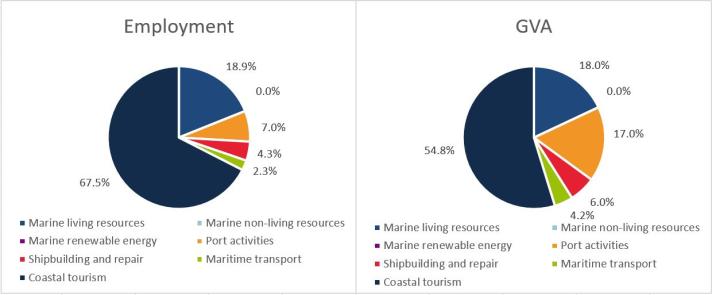
The Spanish Blue Economy is dominated by Coastal tourism, which contributed 68% to Spanish Blue Economy jobs and 55% to GVA in 2021. The relative importance of the Coastal tourism sector has decreased due to the COVID-19 pandemic. Coastal tourism was the sector most impacted by the COVID-19 pandemic, with employment decreasing by half and GVA by more than four times in 2020.
It is followed by the Marine living resources sector, which is also an important contributor, with 19% of the Spanish Blue Economy jobs and 18% of the GVA. Port activities also contribute with 17% to the Spanish Blue Economy GVA and 7% of the employment.
In the EU, Spain ranks first in terms of GVA and employment for Coastal tourism; and first in terms of employment and second in GVA for Marine living resources; and third in terms of GVA and employment for Port activities.

Text description of images at the bottom of the page
Some of the busiest container ports in the EU are in Spain: Port of Algeciras (5th), Port of Valencia (7th), Port of Barcelona (11th), Port of Cartagena (25th), Port of Tarragona (26th), Port of Huelva (28th), and Port of Bilbao (29th) in 2021. These ports are mostly all located in the Mediterranean Sea, only the Port of Bilbao is in the Atlantic Ocean.
The port of Palma de Mallorca (Balearic Islands) and Santa Cruz de Tenerife (Canary Islands) are in the top 20 of EU ports by number of passengers the sixth and tenth, respectively, in 2021.
The Spanish Ministerio de agricultura, pesca y alimentación recognises the importance of the seas and oceans as engines of the economy thanks to the potential for innovation and growth. It launched the strategy Crecimiento azul (i.e. Blue growth), based on the Europe 2020 Strategy, with the objective to support the sustainable growth of the marine and maritime sectors.
The Red Española de Espacios de Conocimiento de Crecimiento Azul (REECCA) has been established to facilitate communication and dissemination within the framework of the strategy Crecimiento azul, and it integrates universities, technology centres and other institutions working in this space.

Canary Islands: The creation of the Canary Islands Blue Economy Observatory (Observatorio Canario de la Economía Azul), one of the main actions of the recently approved Canary Islands Blue Economy Strategy promoted by the Government of the Canary Islands, is due to the need to enhance the coordination and integration of the different public policies that They are carried out in the field of the Blue Economy in the Canary Islands.
The mission of the Canary Islands Blue Economy Strategy (ECEA) is to promote maritime identity and the Blue Economy, where the cultural, environmental, social and economic activities and interactions that take place in the coastal maritime space converge, aimed at improving the public services, sustainability and economic development of the region.

Catalonia: The Maritime Strategy of Catalonia (Estratègia Marítima de Catalunya) is based on the principles of the sustainable ocean planning to achieve an Integrated Maritime Policy (IMP) that emphasizes the environmental dimension and protects sustainability, ensuring the preservation of marine ecosystems that are essential for the provision of services to society. The relevance of the blue economy in Catalonia as an economic engine is shown with a blue economy Gross Added Value and employment above 5% and 3% of the national total, estimated by the Oficina del Mar of the Generalitat de Catalunya. A particularly relevant source of Blue Economy in Catalonia is the maritime recreational activities sector which is developed by local residents throughout the year, creating a considerable economic activity. Therefore, the Maritime Strategy of Catalonia, unlike other European strategies, considers the maritime recreational activities sector as an independent sector from maritime tourism.
The 2023-2026 Plan of the Maritime Strategy of Catalonia focuses on the following four areas of action: i) a sustainable blue economy within the framework of an integrated maritime policy that respects all uses of the sea; ii) healthy and resilient ecosystems; iii) A citizenry that loves and values the sea as a source of well-being and wealth; and iv) an innovative maritime governance in the hands of citizens.
Monitoring of the 2023-2026 Plan
The Catalan Maritime Co-management Council, created by law in 2017, is the governance instrument for the integrated maritime policy. One of the functions of the Catalan Maritime Co-Management Council is to contribute actively to the implementation of the Maritime Strategy of Catalonia, to assess the results achieved in the objectives, strategic lines and planned actions, and guarantee the transparency of all processes. In order to be able to execute these functions, a monitoring method has been developed and implemented with the corresponding indicators to report the degree of compliance with the actions included in the last Plan. You can check here the progress of the Maritime Strategy of Catalonia implementation.

Galicia: The Port of Vigo is a pioneer port in Europe in the implementation of the Blue Growth strategy and Sustainable Blue Economy Communication in a comprehensive manner with the collective work of all users of the port.
The Port of Vigo promotes competitiveness, efficiency and sustainability in all its activities, facilities and services. Amongst its activities, the port works to regenerate the seabed, recover biodiversity throughout the port area and the collection of marine litter.

For more national level data, please visit the Dashboards section within the EU Blue Economy Observatory. Visit the EU Blue Economy Observatory for more information on the Educational and Employment opportunities in the Blue Economy sectors in your country.
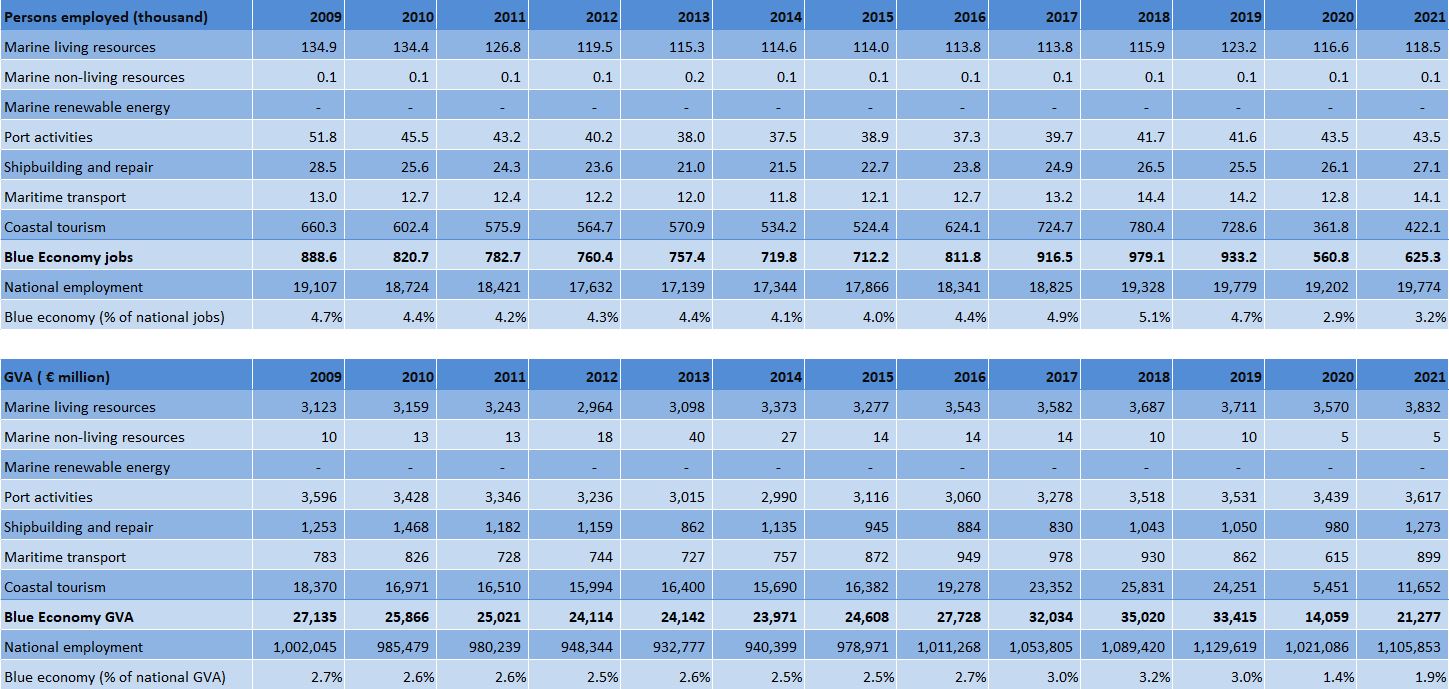
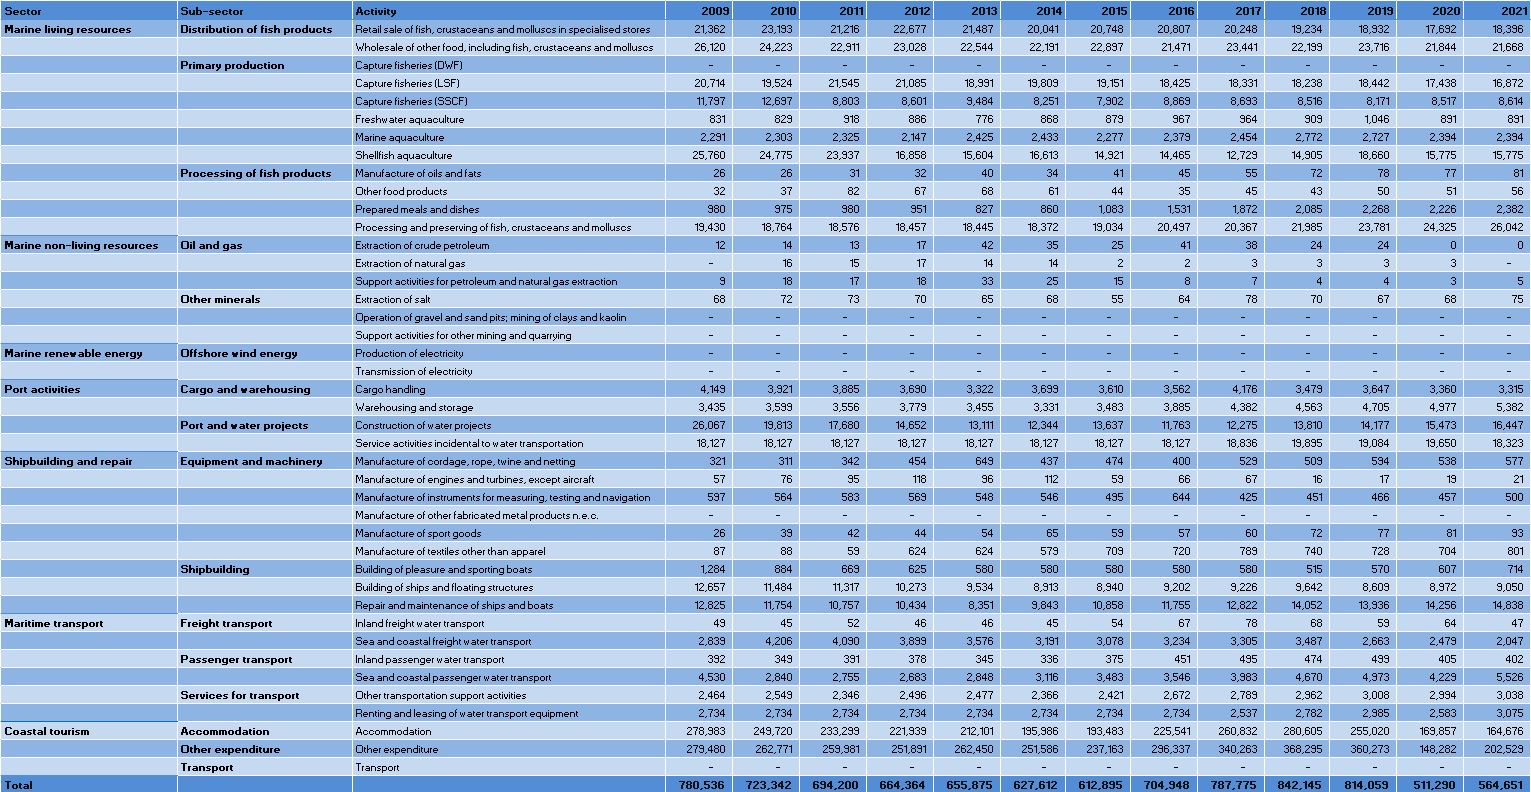
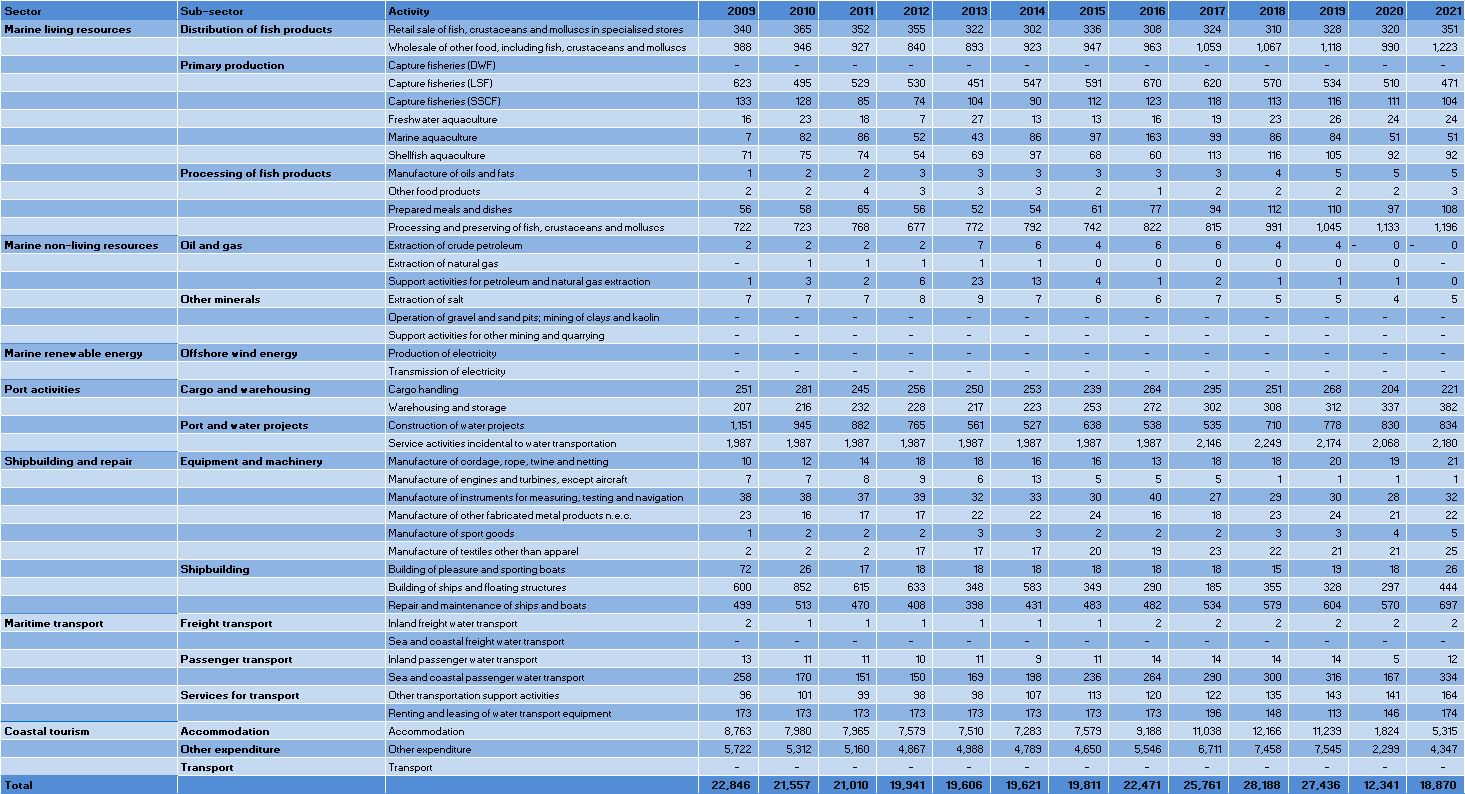
Figure 1: Spain: Evolution of the Blue Economy Established Sectors (2021)
This figure consists of two pie charts that illustrate key aspects of Spain’s Blue Economy in 2021.
- Left Pie Chart: This chart represents the percentage of employment across various established sectors within the Blue Economy. Each sector is depicted as a segment of the pie, with the size of each segment corresponding to its share of total employment. For example, if the segment for "Coastal Tourism" occupies a larger portion, it indicates a higher percentage of employment in that sector compared to others.
- Right Pie Chart: This chart shows the percentage of Gross Value Added (GVA) for each established sector. Similar to the left chart, each segment reflects the contribution of that sector to the overall GVA of the Blue Economy. A larger segment signifies a greater economic impact from that sector.
Together, these charts provide a visual representation of both employment distribution and economic contribution within Spain’s Blue Economy, highlighting the sectors that play significant roles in both areas.
Figure 2: Spain: Evolution of the Blue Economy established sectors (2009-2021)
This figure consists of two tables that illustrate the evolution of established sectors within the Blue Economy in Spain from 2009 to 2021.
First table:
- Structure: The first table has 11 rows and 14 columns.
- Column Overview:
- First Column: Lists the established sectors of the Blue Economy, from row 2 to row 10.
- Columns 2 to 14: Display the number of persons employed (in thousands) for each year from 2009 to 2021.
- First Row: Contains the headers, namely: the title followed by the years from 2009 to 2021, one for each column.
- Last Row: Contains the percentage of national jobs attributed to each sector for each year.
- Structure: The second table mirrors the first, also containing 11 rows and 14 columns.
Second table:
- Column Overview:
- First Column: Again lists the established sectors of the Blue Economy, from row 2 to row 10.
- Columns 2 to 14: Present the Gross Value Added (GVA) for each year (in million euros, M€) from 2009 to 2021.
- First Row: Contains the headers, namely: the title followed by the years from 2009 to 2021, one for each column.
- Last Row: Displays the percentage of national GVA for each sector for each year.
Figure 3: Spain: Evolution of the Employment by Blue Economy Activity (2009-2021) - Persons employed
This table provides a comprehensive overview of employment trends in Spain’s Blue Economy from 2009 to 2021. It consists of 44 rows and 16 columns, with the first row serving as the header that outlines the content of each column, namely: the title followed by the years from 2009 to 2021, one for each column.
- The first three columns include:
- Blue Economy Sector
- Sub-Sector
- Activity
- The next 13 columns display the number of persons employed in each activity for each year from 2009 to 2021. Each cell in these columns contains numerical data representing the employment figures for that specific activity and year.
- The last row (row 44) the last row of the table summarises the total number of persons employed for each year, providing a clear overview of employment trends across the entire Blue Economy.
Overall, this table encompasses 7 sectors, 13 sub-sectors, and 42 activities, making it a valuable resource for analysing how employment in Blue Economy has evolved over the specified period in the specific country.
Figure 4: Spain: Evolution of the GVA by Blue Economy Activity (2009-2021) - M€"
This figure provides a comprehensive overview of the Gross Value Added (GVA) across various activities within the Blue Economy. It consists of 44 rows and 16 columns with the first row serving as the header that outlines the content of each column, namely: the title followed by the years from 2009 to 2021, one for each column.
- The first three columns include:
- Blue Economy Sector
- Sub-Sector
- Activity
- The next 13 columns display the GVA values for each activity from 2009 to 2021.
- The last row (row 44) summarises the totals for each year.
The table encompasses 7 sectors, 13 sub-sectors, and 42 activities, allowing for a detailed analysis of how the GVA has evolved over the specified years. This structured format facilitates comparisons across different sectors and activities, highlighting trends and changes within the Blue Economy in Spain.