The Danish established Blue Economy sectors employ about 98 000 people and generate around €13.1 billion in GVA in 2021. The Blue Economy has a positive impact on the Danish workforce, employing about 3.4% of the national workforce. This share has increased on a year-to-year basis (3.2% in 2020), but is still far from the pre-Covid levels (4.7%). Denmark has recorded a decrease in contribution of Blue Economy sectors to the overall GVA, moving from 4.9% in 2020 to 4.4 % in 2021.
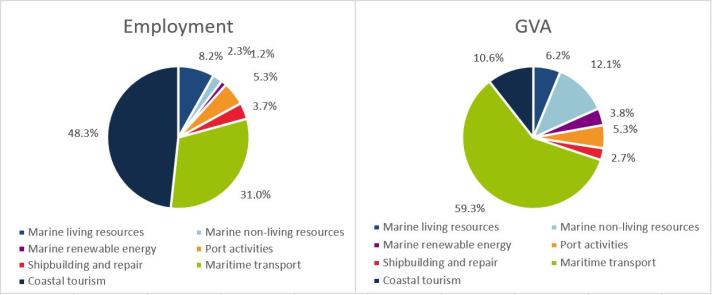
The Danish Blue Economy is dominated by Coastal tourism in terms of people employed (48% of Danish blue jobs). This share is declining over time, with pre-Covid value of 65% and 2020 value of 53%. In addition, in terms of GVA the sector only contributes to the overall national Blue Economy GVA to less than 11% in 2021. Maritime transport generates 59% of the GVA in 2021, an increase compared to 58% in 2020 and 43% in 2019.

Text description of images at the bottom of the page
In the EU, Denmark is the 2nd second -largest contributor in terms of GVA Maritime transport and Marine Non-living resources in 2021. It is also the most important contributor to employment within Marine Non-living resources and the 4th-most important for Maritime transport in the EU.
The busiest container ports in Denmark are: the Port of Århus (95th busiest port in the EU in terms of gross weight of goods handled), Port of Rødby (Færgehavn) (101st) and Port of Statoil-Havnen (111th).
In terms of passengers embarked and disembarked in ports, Helsingør (Elsinore) is the first ranked Danish port (ranked 14th busiest port in EU in 2021), followed by Sjællands Odde (18th) and Århus (19th).

The Danish Maritime Authority is a part of the Ministry of Industry, Business and Financial Affairs, and aims at ensuring competitiveness for the maritime cluster as well as promoting safety and health of the seas.
The Danish Government’s Climate Partnership has launched Blue Denmark with the objective of reducing CO2e emissions over the next ten years, focusing on energy efficiency, ports, shipping and governance.
For more national level data, please visit the Dashboards section within the EU Blue Economy Observatory, where you can also find information about Educational and Employment opportunities in the Blue Economy sectors.
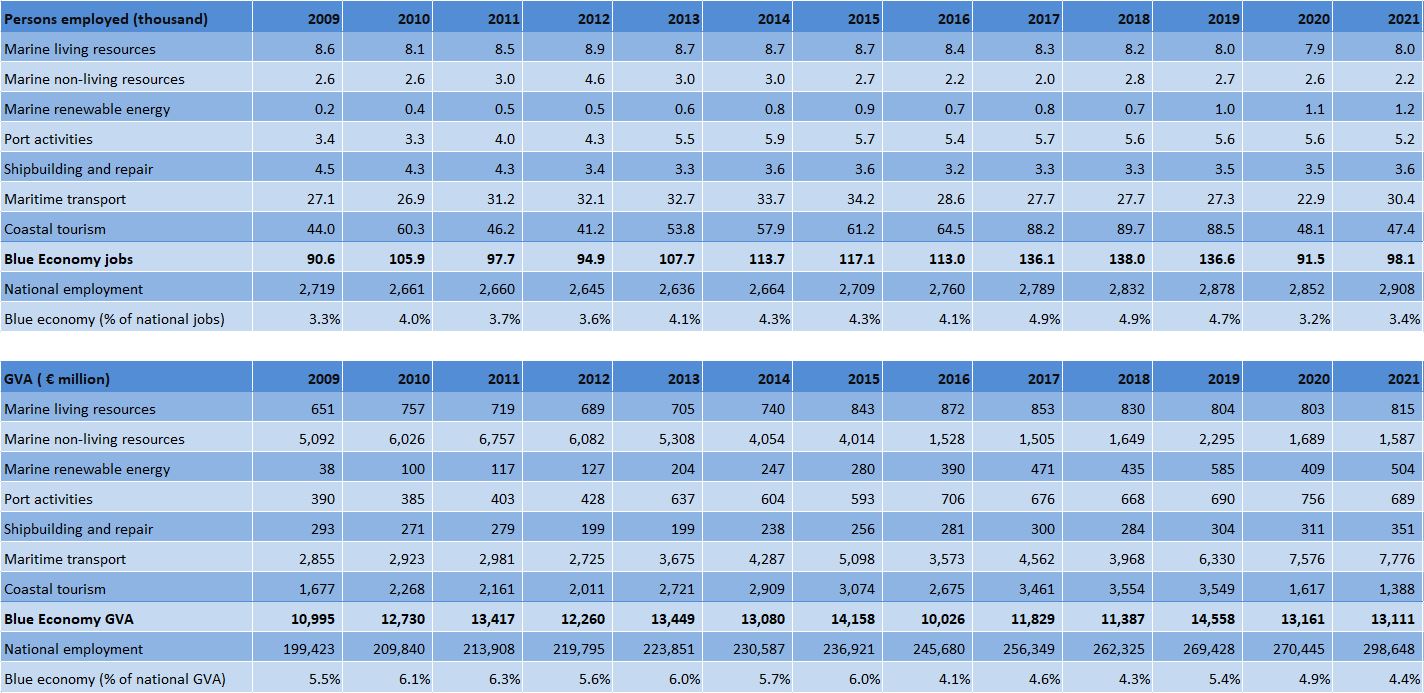
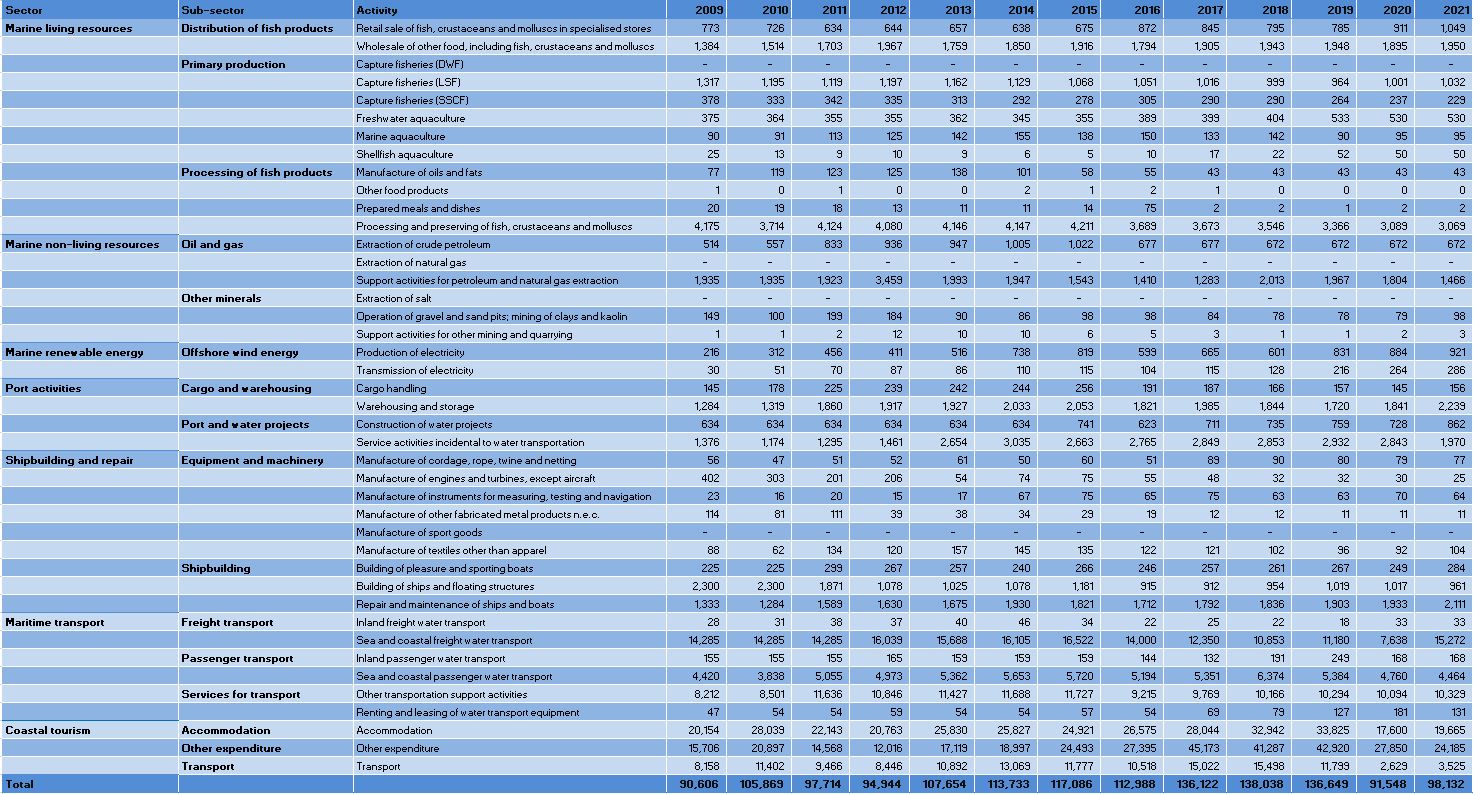
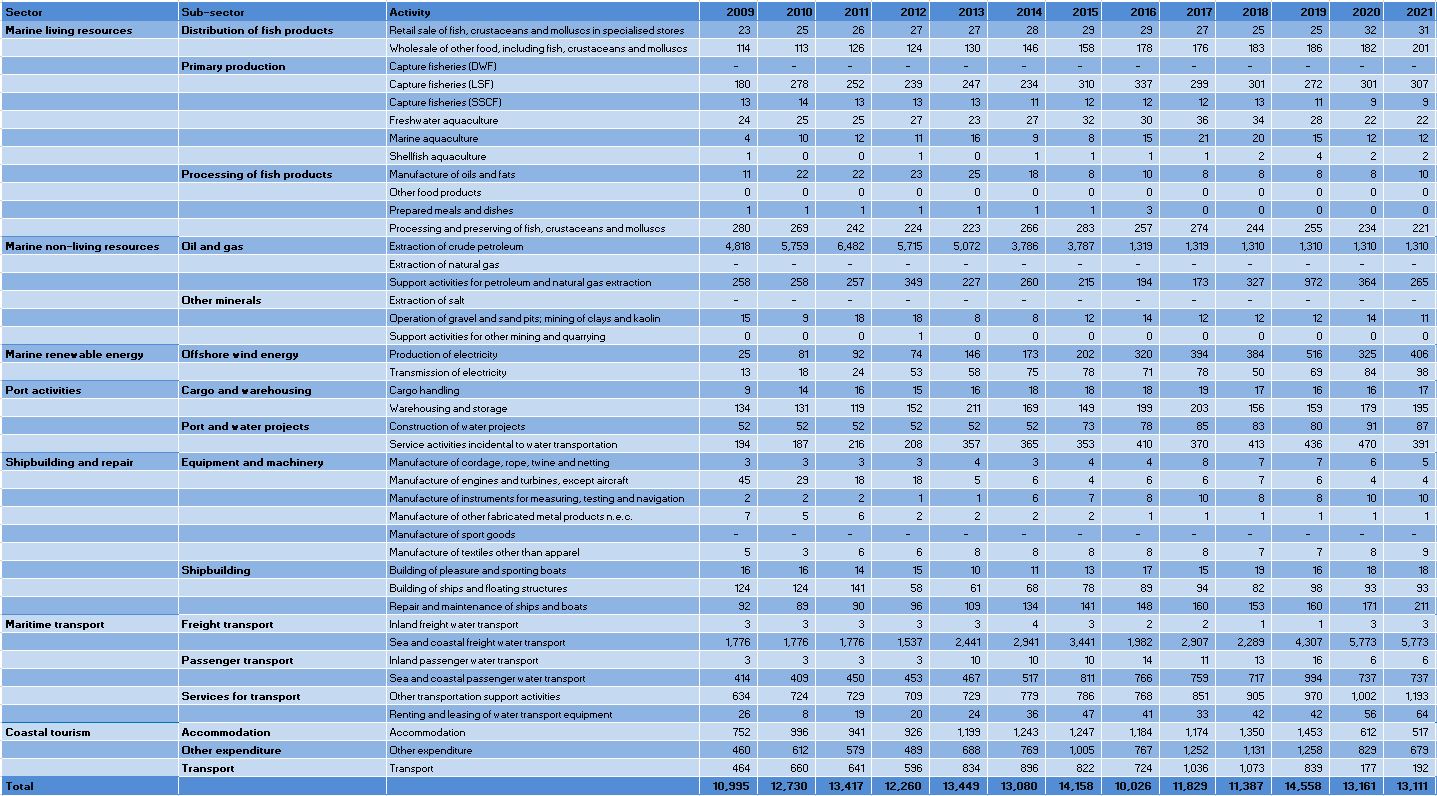
Figure 1: Denmark: Evolution of the Blue Economy Established Sectors (2021)
This figure consists of two pie charts that illustrate key aspects of Denmark's Blue Economy in 2021.
- Left Pie Chart: This chart represents the percentage of employment across various established sectors within the Blue Economy. Each sector is depicted as a segment of the pie, with the size of each segment corresponding to its share of total employment. For example, if the segment for "Coastal Tourism" occupies a larger portion, it indicates a higher percentage of employment in that sector compared to others.
- Right Pie Chart: This chart shows the percentage of Gross Value Added (GVA) for each established sector. Similar to the left chart, each segment reflects the contribution of that sector to the overall GVA of the Blue Economy. A larger segment signifies a greater economic impact from that sector.
Together, these charts provide a visual representation of both employment distribution and economic contribution within Denmark's Blue Economy, highlighting the sectors that play significant roles in both areas.
Figure 2: Denmark: Evolution of the Blue Economy established sectors (2009-2021)
This figure consists of two tables that illustrate the evolution of established sectors within the Blue Economy in Denmark from 2009 to 2021.
First table:
- Structure: The first table has 11 rows and 14 columns.
- Column Overview:
- First Column: Lists the established sectors of the Blue Economy, from row 2 to row 10.
- Columns 2 to 14: Display the number of persons employed (in thousands) for each year from 2009 to 2021.
- First Row: Contains the headers, namely: the title followed by the years from 2009 to 2021, one for each column.
- Last Row: Contains the percentage of national jobs attributed to each sector for each year.
- Structure: The second table mirrors the first, also containing 11 rows and 14 columns.
Second table:
- Column Overview:
- First Column: Again lists the established sectors of the Blue Economy, from row 2 to row 10.
- Columns 2 to 14: Present the Gross Value Added (GVA) for each year (in million euros, M€) from 2009 to 2021.
- First Row: Contains the headers, namely: the title followed by the years from 2009 to 2021, one for each column.
- Last Row: Displays the percentage of national GVA for each sector for each year.
Figure 3: Denmark: Evolution of the Employment by Blue Economy Activity (2009-2021) - Persons employed
This table provides a comprehensive overview of employment trends in Denmark's Blue Economy from 2009 to 2021. It consists of 44 rows and 16 columns, with the first row serving as the header that outlines the content of each column, namely: the title followed by the years from 2009 to 2021, one for each column.
- The first three columns include:
- Blue Economy Sector
- Sub-Sector
- Activity
- The next 13 columns display the number of persons employed in each activity for each year from 2009 to 2021. Each cell in these columns contains numerical data representing the employment figures for that specific activity and year.
- The last row (row 44) the last row of the table summarises the total number of persons employed for each year, providing a clear overview of employment trends across the entire Blue Economy.
Overall, this table encompasses 7 sectors, 13 sub-sectors, and 42 activities, making it a valuable resource for analysing how employment in Blue Economy has evolved over the specified period in the specific country.
Figure 4: Denmark: Evolution of the GVA by Blue Economy Activity (2009-2021) - M€"
This figure provides a comprehensive overview of the Gross Value Added (GVA) across various activities within the Blue Economy. It consists of 44 rows and 16 columns with the first row serving as the header that outlines the content of each column, namely: the title followed by the years from 2009 to 2021, one for each column.
- The first three columns include:
- Blue Economy Sector
- Sub-Sector
- Activity
- The next 13 columns display the GVA values for each activity from 2009 to 2021.
- The last row (row 44) summarises the totals for each year.
The table encompasses 7 sectors, 13 sub-sectors, and 42 activities, allowing for a detailed analysis of how the GVA has evolved over the specified years. This structured format facilitates comparisons across different sectors and activities, highlighting trends and changes within the Blue Economy in Denmark.