Blue biotechnology is defined as the “application of science and technology to living organisms from marine resources, as well as parts, products and models thereof, to alter living or non-living materials for the production of knowledge, goods and services”. Marine organisms that are covered include, amongst others, microbes, microalgae, cyanobacteria, seaweed, invertebrates, and discards of fish and other marine organisms that show potential for the development of innovative and high value products as well as valorisation of co-products.
In and of itself, blue biotechnology is not a standalone economic sector, but it rather encompasses a wide set of activities and applications, which can serve different markets and uses. Its potential for growth, both in Europe and worldwide, is significant due to several factors:
- Rich marine biodiversity: Europe has extensive coastlines and access to diverse marine ecosystems, offering a wide array of marine organisms that can be utilised for biotechnological applications. The ocean is endowed with such a variety of organism that it is reasonable to assume that the overall potential is largely untapped.
Increasing demand for sustainable resources: with growing concerns over sustainability and environmental degradation, there is a rising demand for alternative and sustainable sources of raw materials. Blue biotechnology provides an opportunity to harness resources from the oceans in an environmentally friendly manner.

- Technological advancements: advances in biotechnology, genomics, and bioinformatics have enhanced our ability to explore and exploit marine organisms for various applications. These technological advancements enable the discovery of novel bioactive compounds and the development of innovative bioprocessing techniques.
- Economic potential: the commercialisation of products derived from marine organisms can create new economic opportunities, particularly for coastal communities and regions with a strong maritime tradition. As notable applications include anti-cancer drugs, anti-inflammatory compounds, nutraceuticals and cosmetics, it is worth noting that several blue biotechnology products may have extremely high value added.

Whilst blue biotechnology offers significant growth potential in Europe and globally due to rich marine biodiversity, rising demand for sustainable resources, technological advancements, and economic opportunities for coastal communities, the quantification of its economic value is a complex task. The current statistical classification of economic activities in the European Community (NACE) does not have a specific code for blue biotechnology, which means there is no official data on the turnover, value added, and employment of the sector1. Estimates on the current size and growth prospects of the sectors are only available in a number of sector reports from research organisations, international organisations, and private companies alike. However, each of these reports may use different definitions of blue biotechnology and employ different methodologies for calculations, ultimately making estimates fraught with uncertainties and virtually impossible to compare. Nevertheless, estimates of the global market value (turnover) of blue biotechnology range between €2.5 and €3.9 billion.
![[Image of Algae research in industrial laboratory]](https://blue-economy-observatory.ec.europa.eu/sites/default/files/styles/oe_theme_medium_no_crop/public/2022-04/AdobeStock_266439472.jpeg?itok=L4ncHqge)
For example, Maximise Market Research estimated a market value of €2.51 billion in 2021 and forecasted a Compound annual growth rate (CAGR) of 7.11% from 2022 to 2029, with the market reaching €4.34 billion. Cognitive Market Research projects blue biotechnology growth from €2.83 billion in 2022 to €4.92 billion in 2030 at a CAGR of 8.24%. While Market Research Future (MRFR) estimated a market value of €3.9 billion, reaching €8.9 billion in 2032, at a CAGR of 7.15%.
Regarding the EU, the total market is valued at €868 million in 2021 and is projected to grow to €1,786 million in 2032 at a CAGR of 6.8%, according to MRFR. Germany (28%) and France (23%) alone make slightly more than half of the EU market value and are also projected to grow faster than the other EU countries.
Text description of images at the bottom of the page.
In terms of applications, the medical and pharmaceutical sectors are at the forefront of blue biotechnology development both in the EU and worldwide. As of 2021, it was estimated that “drug discovery” made up 24% of blue biotechnology market value in the EU, with vaccine development, genomics and bioengineering each contributing 13%. Vaccine development and genomics are also believed to contribute the most to the future growth of the sector, with a CAGR of respectively 10.2% and 9.06% until 2032, according to MRFR. These trends are common to all EU MSs and reflect the increasing interest of consumers towards products based on marine compounds, together with the fact that pharmaceuticals and medical applications tend to have high added value.
An insightful analysis of the blue economy sector's recent developments can be gleaned from Hub Azul, a platform launched by Fórum Oceano, Portugal's Blue Economy Cluster. Hub Azul serves as a networking tool connecting blue economy businesses with potential investors. While the data provided is not comprehensive2due to voluntary participation, it still offers valuable insights into emerging industry trends. As of March 2024, there are 163 European start-ups and scale-ups from blue biotechnology that are registered on Hub Azul, with an economic value in 2023 of about €1.1 billion.
In terms of employment, Hub Azul reports 3,957 workers in the sector in 2023. Employment remains concentrated in smaller companies and start-ups. Large enterprises currently employ a relatively small portion of the overall blue biotechnology workforce in Europe. This is usually a typical sign of a nascent and vibrant industry, where most of the business takes place in relatively new and small companies, which have not yet had enough time to grow large. At the same time, the distribution of employment and the predominance of small companies is also a sign of inherent fragility, though it is expected that, as the EU blue biotechnology ecosystem continues maturing, employment at larger companies may increase over time.

One of the difficulties that small companies face in their growth towards commercial maturity is the strain in accessing credit on the private market. Lack of “bankability” hampers investment and business growth, in a “catch-22” where several companies struggle to grow larger but are in fact condemned to remain small. This is because innovative companies are inherently risky. High-risk investments – which ultimately are investments with higher probability to fail – are usually associated with high returns on investments, typically from venture capitalists and equity investors, who are accustomed to taking high risks, if the prospects are good. However, blue biotechnology companies are often too capital-intensive – due to the high costs of research & development – for venture capitalists and too risky for equity financing. In this sense, initiatives such as BlueInvest and EIB loans are of special significance, as they contribute to lower the risk profile of innovative companies.
Nonetheless, the EU blue biotechnology sector is comparatively rather vital and seems to be attracting the interest of venture capital. From the sample of companies and investors covered by Hub Azul, private funding in blue biotechnology tallied €184 million in 20233. The overwhelming majority, approximately 95%, of investments in this segment have been directed towards start-ups focusing on seaweed and algae.
Examples of applications that have been funded are a patented technology to produce therapeutic proteins from spirulina; a technology to develop microalgae-based alternative proteins; seaweed-based feed supplements for reducing cow methane emissions; sustainable, low-carbon, algae-based jet and diesel fuel; and seaweed-based bioplastics.
While seaweed and algae startups dominate the funding landscape, a few companies are exploring other marine resources for innovative applications. For instance, jellyfish are used to produce Collagen Type 0 for complex tissue engineering and regenerative medical applications. Purified hemoglobin from lugworms (Arenicola marina) is extracted to develop marine oxygen carriers for industrial and therapeutic uses.

By leveraging marine biodiversity, technological innovation, and interdisciplinary collaboration, stakeholders can unlock the full economic and societal benefits of blue biotechnology while safeguarding marine ecosystems for future generations.
Some promising applications of blue biotechnology include:
- Development of novel therapeutics
- Nutraceuticals and functional foods
- Bioprospecting and biodiversity conservation
- Bioenergy and bioremediation

The substantial and growing investments in blue biotechnology underscore the increasing recognition of the economic and environmental opportunities presented by harnessing the potential of marine resources across various sectors, from pharmaceuticals and healthcare to food, energy, and sustainable materials. As the industry continues to evolve, further innovations and breakthroughs are expected, driven by the influx of venture capital funding and the vast unexplored potential of the ocean’s biological resources.
Opportunities for growth in blue biotechnology underscore the sector's potential to address global challenges related to human health, food security, energy sustainability, and environmental protection.
Marine organisms produce a wide range of bioactive compounds with potential pharmaceutical applications, including antimicrobial agents, anticancer drugs, and anti-inflammatory compounds. Exploiting these natural resources can lead to the discovery of new drugs and therapies.
- Marine-derived pharmaceuticals: marine organisms produce a vast array of bioactive compounds, many of which have demonstrated pharmacological properties. These compounds have the potential to be developed into novel drugs for various therapeutic applications, including antimicrobial, anticancer, anti-inflammatory, and antiviral agents. For example, seaweeds contain a large variety of phytochemical constituents that can be used in the prevention and treatment of health diseases.4
- Drug discovery and development: blue biotechnology offers opportunities for the discovery of new drug candidates through bioprospecting, screening natural products, and studying marine organisms’ unique biochemical pathways. With the increasing prevalence of drug-resistant pathogens and unmet medical needs, marine-derived therapeutics present promising avenues for drug development.
Marine-derived ingredients can be incorporated into functional foods and nutraceuticals, offering health benefits such as omega-3 fatty acids, antioxidants, and vitamins. The growing demand for natural and functional ingredients presents opportunities for the development of marine-based food and dietary supplements.
- Omega-3 fatty acids and essential nutrients: marine organisms such as fish, algae, and seaweeds are rich sources of omega-3 fatty acids, vitamins, minerals, and other essential nutrients beneficial for human health. These ingredients can be incorporated into functional foods, dietary supplements, and nutraceuticals targeting specific health conditions, such as cardiovascular disease, cognitive function, and immune support.
- Anti-oxidants and bioactive compounds: marine-derived antioxidants and bioactive compounds exhibit potential health benefits, including antioxidant, anti-inflammatory, and anti-aging properties. Incorporating these ingredients into food and beverage products can enhance their nutritional value and appeal to health-conscious consumers seeking natural and functional ingredients. Carotenoid pigments from brown algae for their antioxidant activity as well as positive health effects to treat obesity and type-2 diabetes5.
Exploring marine biodiversity for biotechnological purposes can lead to the discovery of new species and genetic resources with potential commercial value. By promoting biodiversity conservation and sustainable use of marine resources, blue biotechnology contributes to the preservation of marine ecosystems.
- Discovery of novel species and genetic resources: marine ecosystems harbour a vast diversity of species, many of which remain unexplored and undocumented. Bioprospecting expeditions and genetic studies can lead to the discovery of new species, microbial strains, and genetic resources with potential biotechnological applications, including enzymes, bioactive compounds, and metabolic pathways.
- Biodiversity conservation and sustainable use: blue biotechnology promotes the sustainable utilisation of marine resources while conserving biodiversity and protecting fragile marine ecosystems. By adopting principles of responsible bioprospecting, ecosystem-based management, and Maritime Spatial Planning, stakeholders can balance economic development with environmental conservation, ensuring the long-term viability of marine biotechnology initiatives.
Marine microorganisms and algae can be used for the production of biofuels, such as biodiesel and bioethanol, as well as for bioremediation purposes to clean up marine pollution. These applications contribute to the development of sustainable energy sources and environmental conservation efforts.
- Biofuel production: Marine microorganisms, particularly algae, offer a promising source of biomass for biofuel production, including biodiesel, bioethanol, and biohydrogen. Algae cultivation can be conducted in various marine environments, including open ponds, photobioreactors, and offshore facilities, utilising sunlight and seawater to produce renewable energy resources.
- Bioremediation of marine pollution: marine microorganisms possess unique metabolic capabilities for degrading organic pollutants, such as hydrocarbons, heavy metals, and wastewater contaminants. Bioremediation technologies based on marine biotechnology can be applied to clean up oil spills, industrial wastewater, and marine debris, mitigating environmental pollution and restoring ecosystem health.
To find out more about what the Commission is doing to support the EU Algae sector, as well as to discover other infographics, please visit the AAM website.
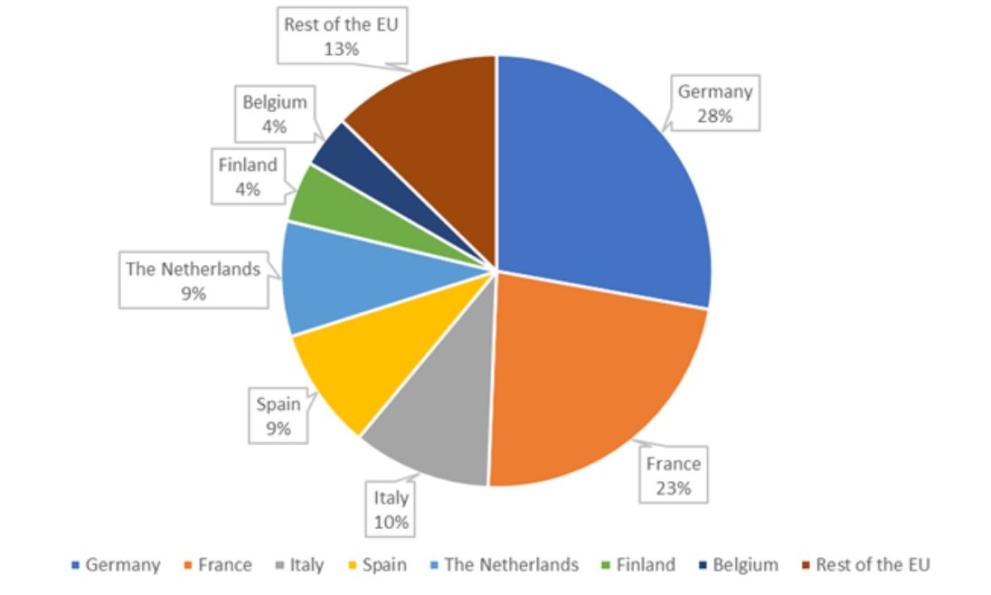
Figure 1: Blue biotechnology market value by EU country, 2021
The pie chart illustrates the distribution of the blue biotechnology market value among EU countries in 2021 as broken down below:
- Total EU Market Value: €868 million in 2021, projected to grow to €1,786 million by 2032 at a compound annual growth rate (CAGR) of 6.8%.
- Germany: Accounting for 28% of the EU market, Germany's share equates to approximately €243 million. It's anticipated to experience a higher growth rate compared to other EU countries.
- France: Representing 23% of the market, France's share is about €200 million. Like Germany, France is expected to see accelerated growth in this sector.
- Other EU Countries: The remaining 49% of the market, totaling around €425 million, is distributed among other EU member states.
This distribution highlights that Germany and France together constitute slightly more than half of the EU's blue biotechnology market value. Both countries are projected to outpace others in market growth, underscoring their significant roles in this sector.
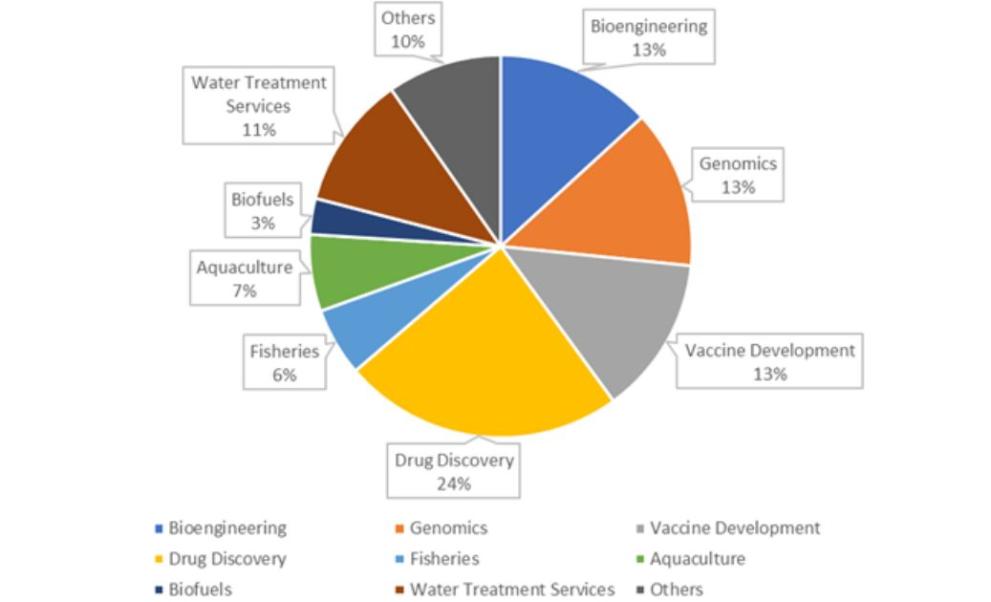
Figure 2: Blue biotechnology market value by application, 2021
The pie chart illustrates the distribution of the blue biotechnology market value by application within the European Union (EU) for the year 2021. Detailed below:
- Drug Discovery: This segment constitutes the largest portion, accounting for 24% of the market. This reflects the significant role of marine-derived compounds in developing new pharmaceuticals.
- Vaccine Development: Representing 13% of the market, this segment highlights the utilisation of marine biotechnology in creating vaccines. It's noteworthy that this area is projected to experience substantial growth, with an anticipated compound annual growth rate (CAGR) of 10.2% until 2032.
- Genomics: Also comprising 13% of the market, genomics involves studying the genetic material of marine organisms. This segment is expected to grow at a CAGR of 9.06% until 2032, indicating its increasing importance in the sector.
- Bioengineering: This application area accounts for another 13% of the market, focusing on applying engineering principles to marine biological systems.
- Other Applications: The remaining 37% of the market encompasses various other applications of blue biotechnology, including environmental management, biofuels, and food production.
These trends are consistent across all EU Member States and reflect a growing consumer interest in products derived from marine compounds. Additionally, pharmaceutical and medical applications tend to offer high added value, contributing to their prominence in the blue biotechnology market.
Blue biotechnology involves using marine resources to develop products and technologies across various industries, including pharmaceuticals, food, and environmental management. The projected growth in this sector reflects increasing investments and advancements in marine-based biotechnological research and applications within the EU.
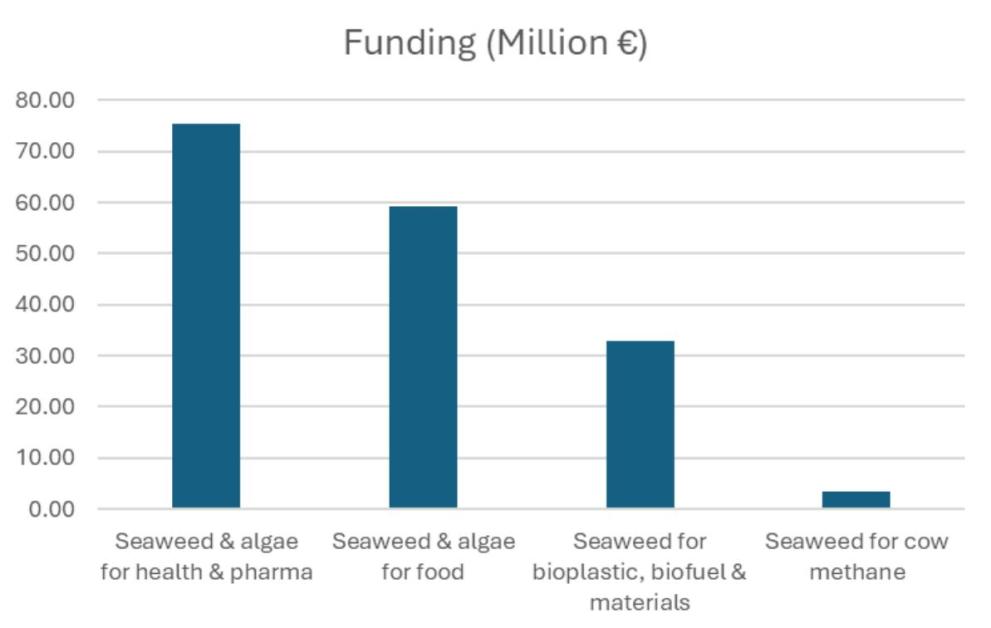
Figure 3: Blue Biotech Funding by Segment (€ millions)
The bar chart illustrates the allocation of private funding within the European Union's blue biotechnology sector for the year 2023.
Total Private Funding: In 2023, the EU's blue biotechnology sector attracted approximately €184 million in private investments.
Seaweed and Algae Startups: A substantial majority of this funding, about 95%, was directed towards startups specialising in seaweed and algae. This equates to roughly €175 million.
This funding distribution underscores a significant investor interest in marine-based solutions, particularly those involving seaweed and algae, due to their versatile applications and potential for high returns. The focus on these areas reflects a broader commitment to sustainable and innovative practices within the EU's blue biotechnology sector.
1 The NACE classification does indeed have a code that groups enterprises working “Research and experimental development on biotechnology” (M 72.11), but this does not allow to discriminate between blue and non-blue.
2 It should also be noted that, as subscription is voluntary, there might also be self-selection and survivorship biases, meaning that the companies that are actually on Hub Azul might also happen to be the most proactive and successful ones, and so they are not representative of the whole population
3 Note that data from the past 12 months are not yet consolidated, and thus are most certainly underestimated.
4 Proksch, P., Putz, A., Ortlepp, S. et al. Bioactive natural products from marine sponges and fungal endophytes. Phytochem Rev 9, 475–489 (2010). https://doi.org/10.1007/s11101-010-9178-9
5 Kurniawan R, Nurkolis F, Taslim NA, Subali D, Surya R, Gunawan WB, Alisaputra D, Mayulu N, Salindeho N, Kim B. Carotenoids Composition of Green Algae Caulerpa racemosa and Their Antidiabetic, Anti-Obesity, Antioxidant, and Anti-Inflammatory Properties. Molecules. 2023 Apr 6;28(7):3267. doi: 10.3390/molecules28073267.