
The established Blue Economy sectors in the Netherlands directly employ more than 141 thousand people and generate approx. €15.4 billion in GVA (2021). While representing a modest contribution to the national economy, the Dutch Blue Economy sectors contributing by approx. 2% to national GVA and 1.5% to national employment.
The size and share of the Blue Economy has remained relatively stable in the Netherlands since 2009. In absolute terms, the number of people employed in the Dutch Blue Economy registered a 32% increase in 2019 from its 2009 level. But it then suffered a 18% decrease in the following year, largely because of the COVID-19 pandemic, before partially recovering in 2021.

In terms of GVA, the share of the Dutch Blue Economy to the national economy decreased from 2.4% in 2009 to 1.8% in 2020, prior to rebounding in 2021 once the pandemic crisis was overcome. In nominal terms, GVA reached its highest level in 2021, thanks to a remarkable 22% increase from the previous year.
The largest Blue Economy sector in the Netherlands is Port activities, which contributed to the Dutch Blue Economy by approximately one third in terms of GVA and almost 26% in terms of employment. The second largest Blue Economy sector of the country is Maritime transport, contributing with 28% and 21% to GVA and employment, respectively. The next largest contributor to GVA is the Marine non-living resources sector (11%), followed by Shipbuilding and repair and Marine living resources (approx. 9% each).

Text description of images at the bottom of the page

However, in terms of employment, the second largest sector is Coastal tourism (24%), which, together with the Marine living resources and Shipbuilding and repair sectors, contribute to nearly half of the country’s Blue Economy workforce.
In the EU, the Netherlands ranks 1st in GVA and 2nd in employment for the Marine non-Living resources sector; 2nd in GVA and 5th in employment for Port activities; 3rd in employment and 4th in GVA for ocean energy; and 3rd in GVA and 5th in employment for Maritime transport.
The Netherlands has amongst the largest container seaports in the EU, serving as major gateways for containerized cargo in Europe. The Port of Rotterdam is by far the largest container port in Europe, handling a significant volume of TEUs (Twenty-foot Equivalent Units) each hear. In 2020, the port handled approximately 14.8 million TEUs of containerized cargo. It is followed by the Port of Amsterdam (4th largest in the EU), and Zeeland Seaports (20th).
The ports of Amsterdam and Rotterdam are also major passenger ports, serving as a hub for ferry services to and from the United Kingdom, and ports of call for cruise ships and other passenger vessels. In total, approx 775 thousand passengers pass through these ports each year (2021 data).
Several organizations are monitoring the Dutch Blue Economy at the national level, as illustrated below:
The Royal Netherlands Institute for Sea Research (NIOZ) is the national oceanographic institute and the Netherlands’ centre of expertise for ocean, sea and coast. The overarching research questions at NIOZ are related to understanding how marine systems work, how they are changing due to anthropogenic and natural impacts, and what benefits can be obtained from them in a sustainable manner.
The Wageningen Marine Research Institute offers independent scientific research and advice on more sustainable management, use and protection of marine, coastal and freshwater areas.
Other national sources of information on the Dutch Blue Economy are:
- Ministry of Infrastructure and Water Management (Ministerie van Infrastructuur en Waterstaat).
- Rijkswaterstaat.
- Netherlands Enterprise Agency (Rijksdienst voor Ondernemend Nederland).
For more national level data, please visit the Dashboards section within the EU Blue Economy Observatory, where you can also find information about Educational and Employment opportunities in the Blue Economy sectors.
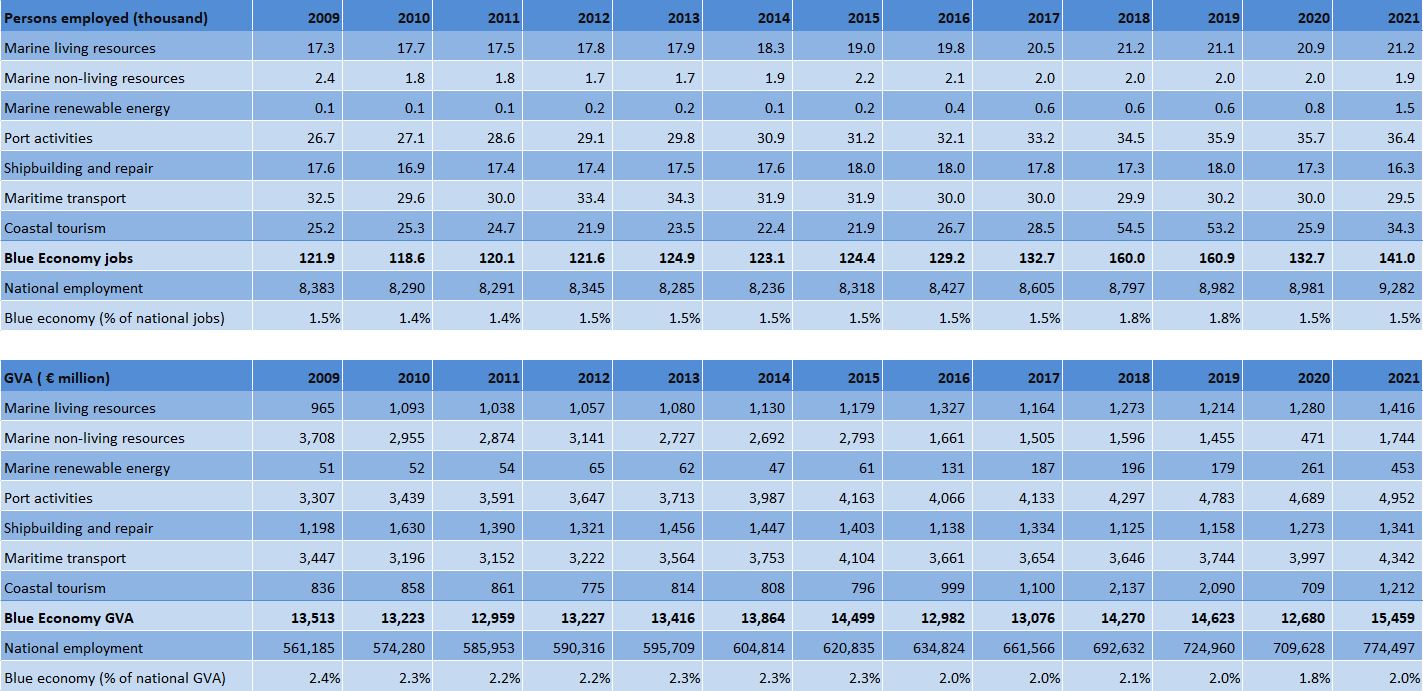

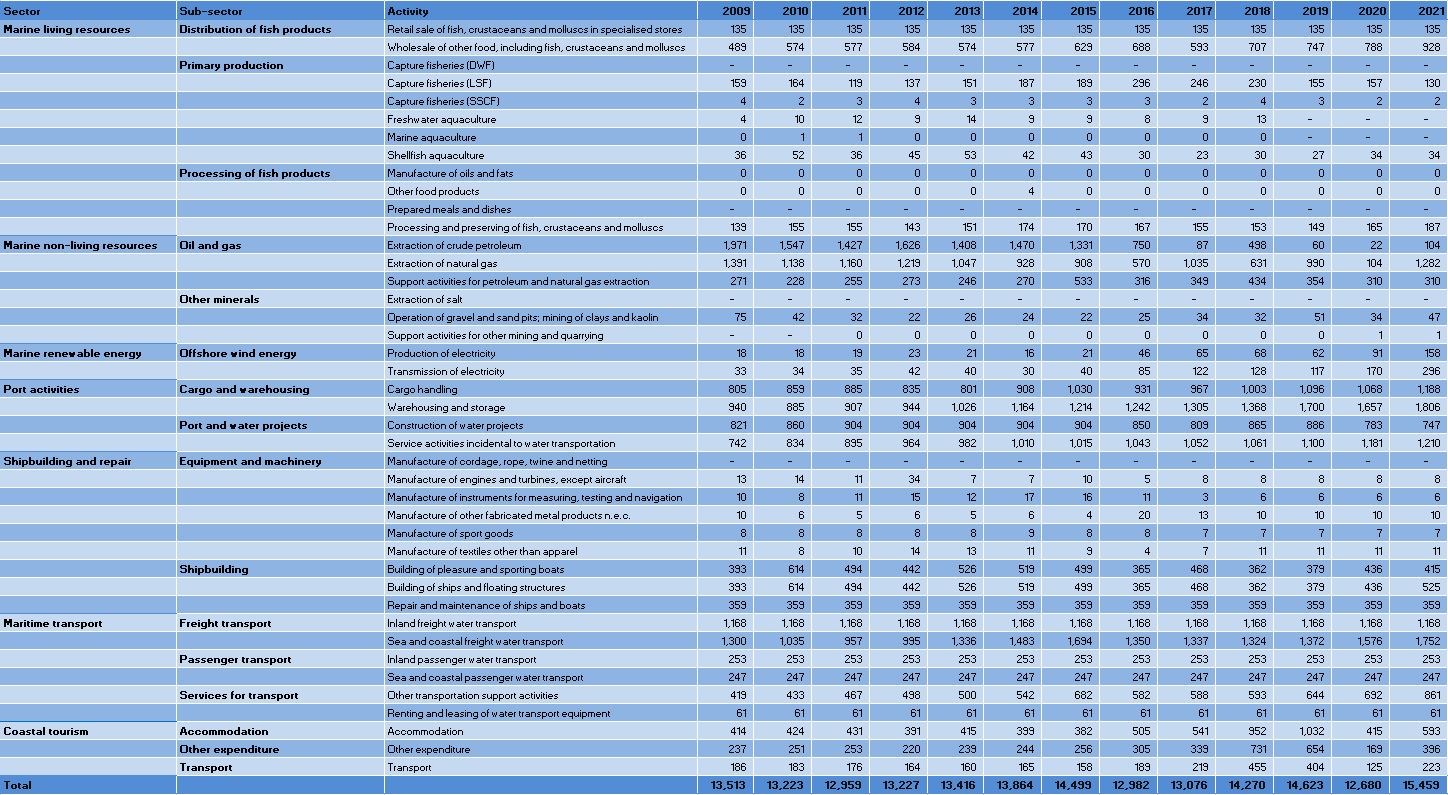
Figure 1: Netherlands: Evolution of the Blue Economy Established Sectors (2021)
This figure consists of two pie charts that illustrate key aspects of the Netherlands Blue Economy in 2021.
- Left Pie Chart: This chart represents the percentage of employment across various established sectors within the Blue Economy. Each sector is depicted as a segment of the pie, with the size of each segment corresponding to its share of total employment. For example, if the segment for "Coastal Tourism" occupies a larger portion, it indicates a higher percentage of employment in that sector compared to others.
- Right Pie Chart: This chart shows the percentage of Gross Value Added (GVA) for each established sector. Similar to the left chart, each segment reflects the contribution of that sector to the overall GVA of the Blue Economy. A larger segment signifies a greater economic impact from that sector.
Together, these charts provide a visual representation of both employment distribution and economic contribution within the Netherlands Blue Economy, highlighting the sectors that play significant roles in both areas.
Figure 2: Netherlands: Evolution of the Blue Economy established sectors (2009-2021)
This figure consists of two tables that illustrate the evolution of established sectors within the Blue Economy in the Netherlands from 2009 to 2021.
First table:
- Structure: The first table has 11 rows and 14 columns.
- Column Overview:
- First Column: Lists the established sectors of the Blue Economy, from row 2 to row 10.
- Columns 2 to 14: Display the number of persons employed (in thousands) for each year from 2009 to 2021.
- First Row: Contains the headers, namely: the title followed by the years from 2009 to 2021, one for each column.
- Last Row: Contains the percentage of national jobs attributed to each sector for each year.
- Structure: The second table mirrors the first, also containing 11 rows and 14 columns.
Second table:
- Column Overview:
- First Column: Again lists the established sectors of the Blue Economy, from row 2 to row 10.
- Columns 2 to 14: Present the Gross Value Added (GVA) for each year (in million euros, M€) from 2009 to 2021.
- First Row: Contains the headers, namely: the title followed by the years from 2009 to 2021, one for each column.
- Last Row: Displays the percentage of national GVA for each sector for each year.
Figure 3: Netherlands: Evolution of the Employment by Blue Economy Activity (2009-2021) - Persons employed
This table provides a comprehensive overview of employment trends in Netherlands Blue Economy from 2009 to 2021. It consists of 44 rows and 16 columns, with the first row serving as the header that outlines the content of each column, namely: the title followed by the years from 2009 to 2021, one for each column.
- The first three columns include:
- Blue Economy Sector
- Sub-Sector
- Activity
- The next 13 columns display the number of persons employed in each activity for each year from 2009 to 2021. Each cell in these columns contains numerical data representing the employment figures for that specific activity and year.
- The last row (row 44) the last row of the table summarises the total number of persons employed for each year, providing a clear overview of employment trends across the entire Blue Economy.
Overall, this table encompasses 7 sectors, 13 sub-sectors, and 42 activities, making it a valuable resource for analysing how employment in Blue Economy has evolved over the specified period in the specific country.
Figure 4: Netherlands: Evolution of the GVA by Blue Economy Activity (2009-2021) - M€"
This figure provides a comprehensive overview of the Gross Value Added (GVA) across various activities within the Blue Economy. It consists of 44 rows and 16 columns with the first row serving as the header that outlines the content of each column, namely: the title followed by the years from 2009 to 2021, one for each column.
- The first three columns include:
- Blue Economy Sector
- Sub-Sector
- Activity
- The next 13 columns display the GVA values for each activity from 2009 to 2021.
- The last row (row 44) summarises the totals for each year.
The table encompasses 7 sectors, 13 sub-sectors, and 42 activities, allowing for a detailed analysis of how the GVA has evolved over the specified years. This structured format facilitates comparisons across different sectors and activities, highlighting trends and changes within the Blue Economy in the Netherlands.