
Marine renewable energy includes offshore wind energy and ocean energy and other sources of ocean energy, two green energy resources that are key to the EU’s ambitions to decarbonise its energy sector.
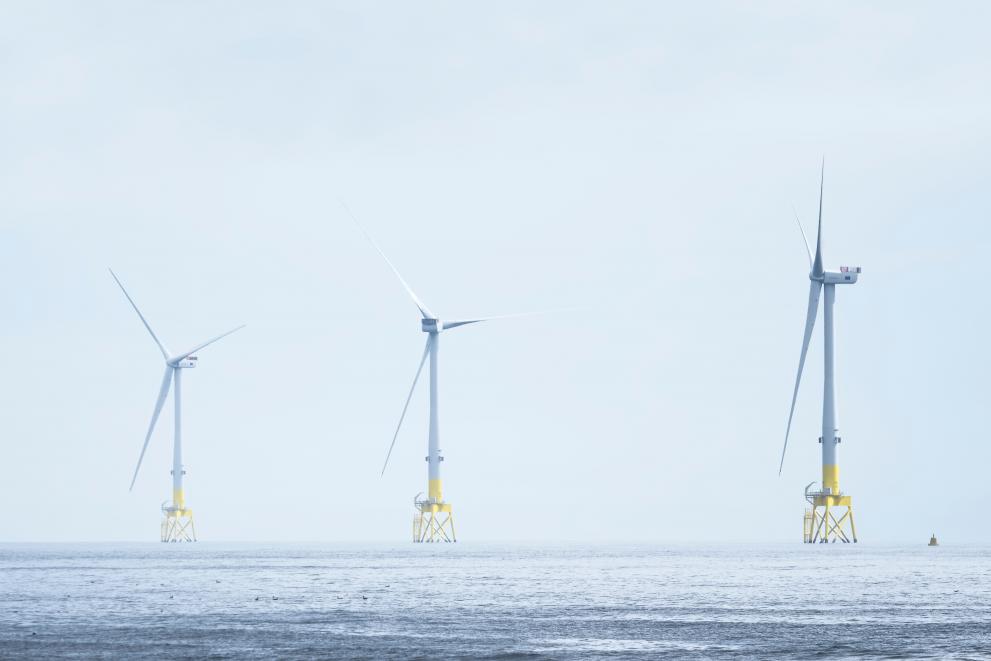
The most consolidated marine energy sector is the offshore wind industry, where bottom-fixed offshore technology still represents the majority of projects, but there is a trend towards floating offshore technologies, with less impact on the seabed.
Ocean energy is a promising sector, where the EU has shown a leading role in technology development.
EMODnet Map wiever allows to see the distribution of plants in Europe.
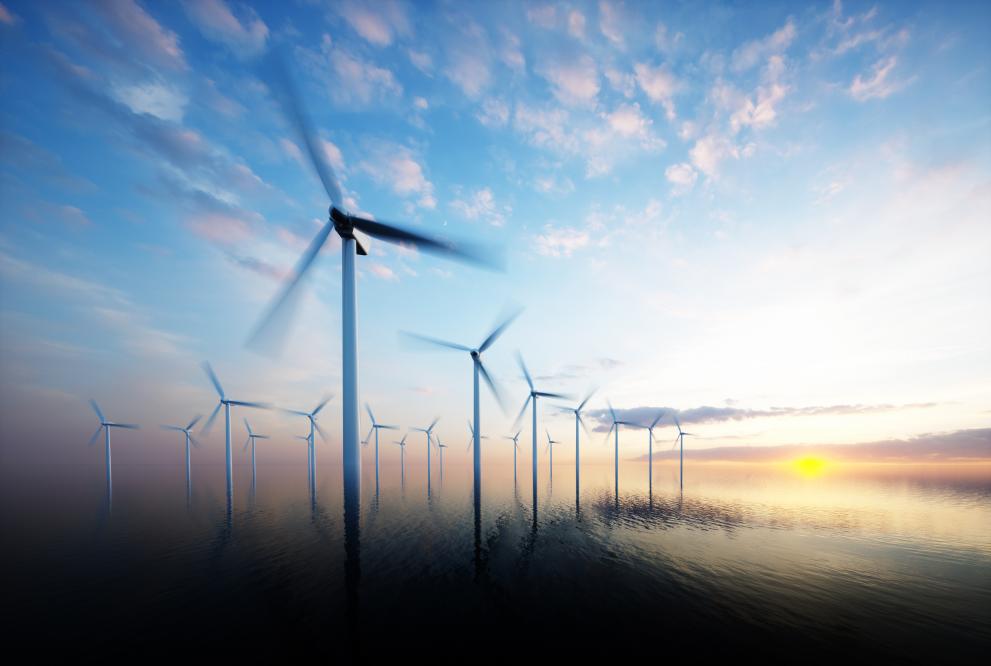
Offshore wind energy is currently the only commercially deployed marine renewable energy with wide-scale adoption. From only a small number of demonstration plants[1]in the early 2000s, the EU now hosts a cumulative capacity of 18.9 GW of offshore wind, spread across 11 countries[2].
The sector generated more than EUR 5.3 billion in GVA in 2022, a 42% increase compared to 2021. Gross profits accounted for EUR 4.1 billion, up 56% since 2021; and the reported turnover was about EUR 25 billion. Provisional data for 2023 show that this growth continued for these three indicators.
The sector directly employed 17 300 persons in 2022 (provisional estimation for 2023: 18 400 people) continuing the general growing pattern observed in the last decade. The average annual wage was EUR 72 100 in 2022, a 4.6% increase compared to 2021 (Figure 1), and was estimated at EUR 71 500 for 2023.


Using Eurostat data and accounting for the production, transmission and distribution of electricity, employment in the offshore sector can be estimated.
Employment: The top contributors are Germany with 69% (11 900 persons), followed by Denmark at 12% (2 100 persons), the Netherlands at 10% (1 800 persons), and Belgium at 9% (1 500 persons) in 2022. The distribution of employment across activities sees 59% of workers in the production, 28% in the distribution and 13% in the transmission of electricity.
Gross value added: The top contributors in 2022 are Germany with 57% (EUR 3.1 billion), Denmark at 19% (EUR 1 billion), the Netherlands at 13% (EUR 0.7 billion) and Belgium at 11% (EUR 0.6 billion). Production of electricity accounts for 68% of the GVA, distribution for 20% and transmission for the remaining 12%.
The employment data in the wind energy industry ecosystem varies significantly across different sources, which typically include different activities along the chain. Whilst Figure 2 provides data on employment in the offshore wind sector for the production, transmission and distribution, it does not report a comprehensive quantification of the total offshore wind employment since other crucial activities, such as manufacturing of components, are not considered due to lack of data.

WindEurope has calculated direct and indirect jobs in the European (EU and UK) wind industry, for the onshore and offshore sectors. Figure 3 shows the direct employment for the EU offshore wind sector, and it includes energy developers, offshore wind turbine manufacturers, offshore service providers, and offshore wind energy substructures for the years 2011 to 2019. Due to a lack of specific data, it is assumed that the EU to UK share of employment is determined by the ratio of offshore wind installed capacity, which leads to an approximation of EU employment.

A different estimate is provided by 4c Offshore[3], which adapts and extends calculations made by Deloitte for etipwind.eu. As presented in Figure 4, the offshore wind industry supported approximately 47 000 full-time equivalent (FTE) jobs in the EU in 2024, with 28 000 being direct jobs (Figure 4). Notably, this estimate is based on the relative proportions of annual installation activity and cumulative installations, which may differ from the methods used by WindEurope.
The discrepancy in employment numbers and methodologies between these sources highlights the complexity and variability of quantifying jobs in the offshore wind industry.

The European offshore wind sector has undergone significant transformation over the past decade and a half, driven by a combination of technological innovations, economies of scale, and supportive policies. As a key component of the EU's energy mix, offshore wind has benefited from the experience and expertise gained in the onshore wind sector, as well as from the development of new technologies and practices. With its vast potential for power generation, offshore wind is now poised to play a vital role in helping the EU achieve its climate and energy goals, including the transition to a carbon-neutral economy.
The European Union has set ambitious targets for offshore wind, aiming to deploy approximately 111 GW by 2030 and 317 GW by 2050, which will contribute to achieving 42.5% of total energy consumption from renewables by 2030. This year, the EU has taken further steps to support the development of net-zero technologies, including offshore wind, with the introduction of the Net Zero Industry Act. This landmark legislation aims to boost the manufacturing of net-zero technologies within the EU, ensuring the region remains a leader in the global transition to a low-carbon economy. By combining these initiatives, the EU is well-positioned to meet its ambitious offshore wind targets, drive innovation, and create a sustainable future for generations to come.
By the end of 2023, the cumulative installed capacity for offshore wind in the EU had reached 18.9 GW, with an increase of 2.1 GW compared to the previous year. The largest capacity additions for 2023 were in the Netherlands (1 529 MW), and Germany (599 MW). Although the EU experienced a relative slowdown in offshore wind deployments since 2020, the last two years have seen a rebound in activity. Preliminary and provisional data for 2024 indicate a total addition of 2.2 GW, bringing the cumulative total to 21.2 GW (Figure 5). The largest capacity additions for 2024 are provisionally reported to be in France (994 MW), the Netherlands (902 MW), and Denmark (344 MW). The growth in installed capacity is a testament to the EU's expertise and equipment being exported worldwide, further cementing its status as a global hub for offshore wind energy.
EU headquartered manufacturers dominate the EU offshore wind market accounting to almost all new deployments in 2023. The US is an important market for European suppliers illustrated by considering the 5.8 GW currently in construction where approximately 52% of CAPEX (i.e. capital expenditure) was awarded to EU-headquartered companies[4]. Several EU-headquartered tier-1 suppliers (i.e. direct suppliers to the company that assembles or sells the final product) have made significant investments in US based facilities including EEW in Paulsboro, Philadelphia (monopiles) and Nexans, South Carolina (subsea cables).
Floating wind energy is an emerging sector within the offshore wind industry that is progressing steadily toward commercial viability. Floating wind enables deployment in deeper water compared to bottom-fixed turbines, increasing the potentially available marine space and wind resources. This is particularly attractive for Member States whose deep-water seas (over 50 m) have so far limited the development of conventional fixed bottom offshore wind energy. Several projects are already operational, and many are planned for the next few years.
Technological differences between projects are mainly linked to the floating structure. Most projects use semi-submersible floater technologies, while fewer projects use spar-buoy, barge, tension-leg platforms or semi-spar floater technologies. Semi-submersible and spar-buoy technologies have already reached the Technology Readiness Level (TRL) 8-9, while the Floatgen pilot project in France upgraded the concrete barge technology to TRL 7-8. Tension-leg platform technology is tested with a prototype (TRL 6) launched off the coast of Canary Islands, the PivotBuoy project by X1 Wind.
Current floating wind energy projects in the EU account for 29 MW of operating projects, with an additional 90 MW underway in France[5]. One of the first floating wind projects in the EU was the WindFloat 1 project in Portugal, whose initial 2 MW capacity (2011) has since been scaled-up to 25 MW (in the newly-named WindFloat Atlantic project, 2019); later followed by the Floatgen project in France with 2 MW capacity, operational in 2018. More recently, in 2023, Spain deployed a 2 MW project, DemoSATH, and in February 2025, Archime3 by Beridi Maritime completed construction of its 0.5 MW full-scale prototype, the TRIWIND floating platform, showcasing the continued interest in floating technology. Also in 2023, in France, construction of the 30 MW EolMed project, 25 MW Provence Grand Large project, and 5 MW demonstrator Eolink began. In 2025, construction of the 30 MW Golfe du Lion (EFGL) project also began. Multiple auctions planned in France, Spain, Italy, Portugal, Greece and the UK demonstrate Europe’s steady development of floating wind (see Table 1). Installed capacity is expected to grow towards 3 GW by 2030 and over 40 GW by 2040. Floating wind is also expanding worldwide, with an installed capacity expected to reach almost 7 GW by 2030 and over 70 GW by 2040. A summary of floating Offshore Wind Projects Auction price and status in European waters is presented in Table 1.
| Country | MW | Year | Auction, Price, Status |
| France | 270 MW | 2024 | AO5: Awarded to BayWa r.e., Elicio’s Pennavel project in Sud de la Bretagne I Price: EUR 86.45/MWh |
| 2 x 250 MW | 2024 | AO6: Two projects in the Mediterranean façade awarded to Ocean Winds, Caisse des Dépôts for Project 1 (Narbonnaise I) and Maple Power, EDF for Project 2 (Golfe de Fos I) Average Price: EUR 89.3/MWh. | |
| 2.2–2.9 GW, including floating | 2025 | AO9: 12 candidates, including the winners of AO5 and AO6 were shortlisted to participate in the tender. Between 1.2 and 1.65 GW will be to extend the floating projects awarded in both AO5 and AO6. | |
| 9.2 GW, including floating | future | AO10: In October 2024, plans outlined for at least two future tender rounds. The tenth round includes five projects, three of which are floating projects totalling 5.2 GW. | |
| 6.3 GW mix of fixed and floating | future | AO11 and beyond: Four separate zones, totalling 6.3 GW will be launched in one or more subsequent tenders for projects to be commissioned by 2040 but the foundation types are not yet specified. | |
| Greece | 1.9-2.5 GW | 2027 | Aiming to launch the first auction in 2027 for a capacity between 1.9 and 2.5 GW spread across six sites, all floating. |
| Italy | Undecided | 2025 | In December 2024, the Ministry of Environment and Energy Security (MASE) approved the operating rules for the new state aid scheme, FER 2 which allocates 3.8 GW between 2024 and 2028 for offshore wind projects 12 NM from shore for EUR 185/MWh. The first auction should take place in the summer 2025 but there are not yet any details about the capacity that will be offered. |
| Spain | Future | After approving its new framework in September 2024, Spain still needs to release the regulatory implementation details. Two ministerial orders, separated by a consultation phase, are required before the launch of Spain’s first auction. | |
| Portugal | Future | In January 2025, the Council of Ministers approved a resolution to the ‘Allocation Plan for Offshore Renewable Energy’ (PAER), which defines the areas to be explored for offshore wind and automatically updates the maritime spatial plans (PSOEM). However, in March, the minority government lost a vote of confidence, and a snap election is expected in May, likely delaying legislation for the prequalification phase and the auction launch. | |
| Norway | 1.5 GW | 2025 | 2025: The Utsira Nord auction continues to face delays due to the EFTA Surveillance Authority (ESA) asking questions of the Ministry of Energy. Recently, the Secretary of State, Astrid Bergmål stated the auction is just around the corner, but the award may be after the election in September. |
| UK | 0.03 | 2022 | AR4: TwinHub, in the Celtic Sea, secured a CfD for £87.3/MWh (in 2012 prices) for 15 years. |
| 0 | 2023 | AR5: No bids due to low ceiling price set in the auction. | |
| 400 | 2024 | AR6: Green Volt (560 MW) acquired a 400 MW CfD in the round with a target commissioning (tax) year of 2028/29. | |
| Undecided | 2025 | AR7: Introduces a new Clean Industry Bonus (CIB) to help develop the local supply chain. Floating will have a guaranteed (but not revealed) minimum to this bonus. | |
| Undecided | 2026 | AR8: Floating expected but no further information available | |
The LCOE of floating wind is currently higher than that of bottom-fixed wind. This is partly due to the more intensive manufacturing and engineering requirements but also due to low-deployment levels which has restricted scale economies and learning opportunities to date. Additionally, multiple competing floating substructure technologies are in development which further prevents standardisation. The commercialisation of floating wind has moved from a pre-2030 to a mid-2030s timeframe.
The LCOE is also more project-dependent. For the years 2020-2023, LCOE ranged between 145 EUR/MWh (Hywind Tampen project in Norway) and 350 EUR/MWh (Fuyao project in China), with WindFloat Atlantic in Portugal at an intermediate LCOE of 240 EUR/MWh[6]. A clear understanding of the LCOE of floating wind is challenging due to the limited deployments and high variance in offtake contracts[7].
Emerging from COVID-19, the world was faced with global supply-chain shortages, logistical challenges brought on by travel restrictions, and rising energy costs, which were then exacerbated by Russia’s war of aggression against Ukraine. High inflation, tight supply chains and rising interest rates disproportionately impacted the capital-intensive offshore wind market, eroding the business case for many projects. In 2022, a record low of final investment decisions (FID) was observed. Although 2023 and 2024 showed investments recovered to pre-pandemic levels (Fig. 5), some markets have been slow to adjust to the new risk and cost environment, meaning forecast growth is below previous trajectories. For example, the Danish 3GW Nordsøen tender in December failed to attract any bidders, as did the UK’s Allocation Round 5 auction in 2023. Globally, there are many cases of disappointing turnouts at auctions.

The decrease in the sector’s attractiveness has coincided with the increasing volume of auctions needed to reach build-out ambitions. Consequently, the relative attractiveness of a market and its auction design are increasingly important to ensure a successful auction outcome and future installations.
Comparing the results of different offtake auctions is challenging because no two jurisdictions or auctions are the same. Even small differences can have significant impacts on the perceived, or actual, costs, benefits and risks for participants in the auction. Examples of factors influencing volume and prices awarded at offshore wind auctions are summarised in Table 2.
| Market Context | Qualification Criteria | Evaluation Criteria | Contract |
Energy policies Legal framework for permitting and building projects Industrial strategy | Required technical and financial capacity Track record Required project development status (lease agreement, grid agreement, permits) Project design Bid bond | Price: Non-price (can be qualitative or quantitative): Socio economic costs and benefits | Structure: Contract for difference Length of contract (15, 20, 25 years |
Meeting European offshore wind goals will require rapid and concentrated deployments of projects. Rather than radial connections to the grid, European Transmission System Operators (TSOs) are pursuing a strategy of cooperation and coordinated planning, facilitated by standardization and interoperability. Industry has settled on a 2GW 525kV High Voltage Direct Current (HDVC) platform-based grid connection concept as the design basis. For example, TenneT, the legally mandated offshore TSO for the Netherlands and one of three in Germany alongside Amprion and 50 Hertz, is building out a cumulative 45 GW of connectivity across both countries, of which 28 GW is HVDC.
To facilitate deployment, contracting has moved from a link-by-link basis to large multi-year framework agreements for the supply and installation of multiple platforms, their foundations and connecting cable systems. For example, Tennet has signed multi-year framework agreements for 28 installation slots for 14 jackets and 14 platforms. Awards have been made to Allseas supported by subcontractor Boskalis and Heerema Marine Contractors with the possibility for extensions[8].
Several countries have awarded or are in the process of awarding framework contracts for offshore HVDC coordinated grids (Netherlands, Germany, Netherlands, France and the UK). Given high demand for offshore HVDC connections, securing supply of HV equipment has become critical for timely project delivery. Historically HVDC systems have taken 4-5 years to deliver, but with current global supply chain constraints and high demand, timelines are now 6-7 years from contract finalisation, with contracting taking an additional year. Transformers are particularly challenging as they interface to the local AC grid and therefore require customisation.
The shift to framework contracts provides visibility on long-term revenues and therefore gives Original Equipment Manufacturers, OEMs, such as Hitachi the confidence needed to invest in facilities and training. Such multi-project procurements, when coupled with technology standardization create synergies between successive projects, reducing costs and increasing productivity and timeliness.
Ocean energy technologies offer an option for developing marine energy production complementary to the offshore wind industry. Ocean energy projects employ a range of technologies that harness tidal, wave, ocean thermal energy conversion, and salinity gradient from the oceans. These projects attract public and private investments, with some of the more advanced projects reaching high TRL and LCOE slowly approaching those of more established offshore energy sectors. Notwithstanding the substantial investment in ocean energy, the commercial viability of this sector remains hindered by numerous obstacles that impede the widespread adoption of ocean energy technologies, such as the considerable upfront costs, the technological uncertainties and the evolving regulatory framework, which does not provide clear guidelines for the industry. The 2020 EU strategy on offshore renewable energy aims to increase the contribution of ocean energy to the EU’s offshore installed capacity targets, from 1 GW in 2030 to 40 GW in 2050[9].
Tidal energy is the first of the ocean energy technologies to have been implemented at a large scale, with barrages in France (1966), China (1975, 1985) and South Korea (2011). These barrages make use of tidal range technology, which captures the potential energy stored between a basin and the external sea. While tidal range projects are commercially viable – thanks to their similarity with the hydropower sector – the deployment of such facilities has been limited by the availability of suitable locations and by the significant local environmental impacts. New technologies have emerged as an alternative, exploiting tidal stream rather than tidal range. These tidal stream technologies include horizontal axis turbine (TRL 9), tidal kite (TRL 9), enclosed tips (TRL 7), vertical axis turbine (TRL 7), undulating membrane (TRL 7) and oscillating hydrofoil (TRL 6). In 2024, Seaqurrent tested a new tidal kite (TRL 6) in the Netherlands[10]. EEL Energy is pursuing the tests of its oscillating hydrofoil (TRL 6) in several locations in France.
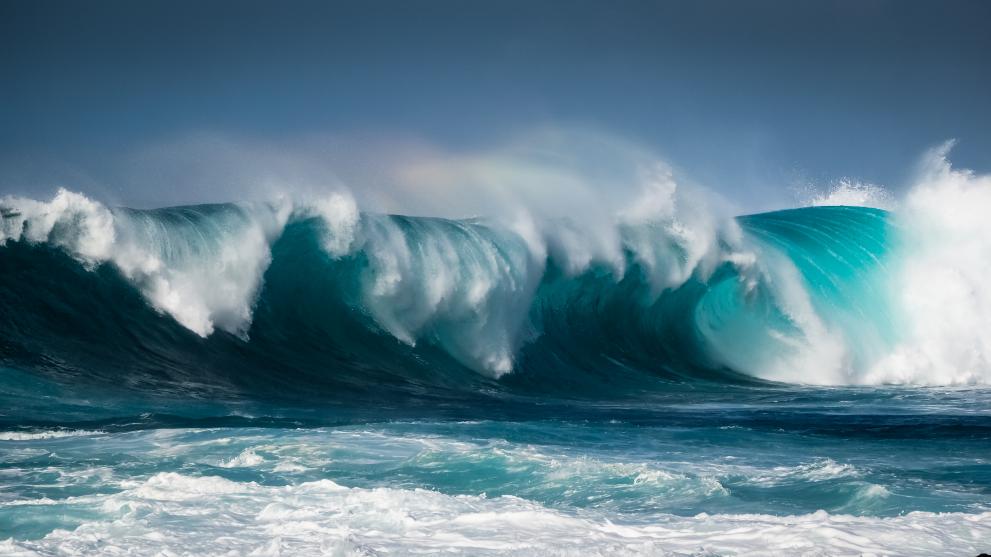
Harnessing the surface motion of ocean waves, wave energy technologies include oscillating water column (TRL 9), point absorber (TRL 9), oscillating wave surge converter (TRL 8), overtopping (TRL 8), attenuator (TRL 8), pressure differential device (TRL 7), rotating mass (TRL 7) and Archimedes screw (TRL 6). Over the past years, some of these technologies have been installed and operated in Spain and Italy (oscillating water columns) and in Portugal and Sweden (point absorbers). Others are being tested in the UK (point absorber and attenuator system), France and Italy (oscillating surge converters). In 2024, a new point absorber built by Seaturns (TRL 6) has been tested in France[11]. Dutch company Wavepiston has finalised the installation of its oscillating wave surge converter (TRL 8) on the Oceanic Platform of the Canary Islands in Spain[12]. The connection of the system with energy collectors was completed in 2025[13]. The C4 point absorber (TRL 7) built by Swedish company CorPower is completing on-land inspection and upgrades, to be redeployed off the coast of Portugal. The Slow Mill Sustainable Power wave device in the Netherlands also underwent dry testing in 2024; it is set to start electricity production in 2025[14].
Salinity gradient power (or osmotic power) uses salt content differences between freshwater and saltwater. This technology has mainly been tested in EU basins, with a Reverse Electrodialysis demonstration plant commissioned in 2014 by RedStack in the Netherlands (TRL 7), and a new start of electricity production in 2024 for a new demonstration plant built in France by Sweetch Energy (TRL estimated at 5-6).
Ocean thermal energy conversion (OTEC) exploits the temperature difference between deep cold water (at 800 to 1 000 m depth) and surface warm water. The technology has been tested by developers in Japan and the US (TRL 8), and at a smaller scale in China and India[15].
| Ocean energy projects led by EU-based companies also include testing and commissioning devices beyond EU waters. Since 2021, the UK has been hosting an axial flow turbine installed by the Spanish company Magallanes. Both Magallanes and French-British company Hydrowing have been awarded further deployment of their technologies by the last Contract for Difference round organised by the UK government[16]. Swedish company Minesto have tested and commissioned two tidal kite technologies in the Faroe islands. These projects are included in an ambitious plan for supplying Faroe with electricity from ocean energy[17]. |
While belonging neither to the offshore wind nor the ocean energy sector, floating photovoltaic technologies are considered as part of the Blue Economy for their use of the maritime space and for their integration into maritime value chains and port infrastructures. The Netherlands are particularly active in testing and installing these technologies. The North Sea 2 farm, commissioned by Dutch company Oceans of Energy, reached full capacity in 2023. In 2024, a new solar floating farm was installed by Dutch-Norwegian company SolarDuck. Several installations are planned by Oceans of Energy in the Netherlands and Belgium in 2025. The technology is being developed in France by SolarinBlue, which is currently testing its anchoring system.
Given the different dynamics for both installation types, this section differentiates ocean energy capacities between those using emerging technologies (tidal stream, wave, OTEC, salinity gradient) from the infrastructures using the established tidal range technology.
At the end of 2024, emerging operational ocean energy capacities in the EU (i.e. ocean energy capacities excluding the already-established tidal range technology projects) accounted for 2.82 MW, including 1.63 MW for tidal energy, 1.12 MW for wave energy and approximately 70 kW for salinity gradient[18]. In 2024, 770 kW of emerging ocean energy capacities were installed or tested in the EU, slightly above the 715 kW additions in 2023 (see Figure 15). There is currently no operating capacity in the EU or in Europe for OTEC technologies. EU-based companies have also been active outside EU waters, with a 1 200 kW capacity addition in the Faroe Islands.
The only established ocean energy capacity in Europe, the La Rance tidal barrage (240 MW), has experienced capacity losses over the past decades due to the ageing installation[19]. This led the whole ocean energy capacity in the EU (emerging and established capacities that are operational) to remain relatively stable over the past 10 years (2014-2023), despite new additions in emerging ocean projects. The barrage should recover part of its initial capacity after the current phase of renovation (2021-2026)[20]. Since 2011, no new project using tidal range technology has been developed. In 2023, according to the IRENA, the whole operational ocean energy capacity - both emerging and established - reached 508 MW globally[21]. Europe accounts for approximately half of the global capacity (243 MW out of 508 MW).
Ocean energy is also becoming increasingly significant in terms of energy production. In 2024, with the advancement of renovation works, electricity production from La Rance tidal barrage was expected to be restored at a level of 520 GWh[22], compared to an average of 500 GWh over the past years. This production is equivalent to the electricity consumption in the nearby regional capital of Rennes (over 200 000 inhabitants). La Rance power plant has been operating for 58 years. Some of the emerging ocean energy capacities have also reached several years of operation and have proved their reliability in providing electricity to the grid (e.g. in Spain and in France). During its first two years of operation, in 2018 and 2019, the MeyGen tidal array located in the UK produced 24.7 GWh of electricity, generating EUR 8.4 million of revenue[23]. According to the latest estimates, the array reached the milestone of 68 GWh of electricity production in 2024. Its planned operation period is 25 years. In Spain, the Mutriku wave power plant has reached a total electricity production of 3 GWh for over 10 years of operation between 2011 and 2024. In France, a Sabella turbine has been operating since 2022 off the coast of Ouessant Island, supplying a significant share of the island’s electricity consumption[24].

Emerging ocean energy technologies are not established enough to be commercially viable through their revenue from energy production. According to the IRENA (2019)[25], the levelised cost of energy (LCOE) range from 110 to 480 EUR/MWh for tidal energy, and from 160 to 750 EUR/MWh for wave energy. In 2022, OceanSET estimated the average LCOE for whole-system TRL 7-9 at 200 EUR/MWh for tidal energy and at 270 EUR/MWh for wave energy[26]. As tidal energy projects progress toward commerciality, a reference price at which electricity will be sold to the grid is available for the most advanced projects. The reference price for Flowatt tidal farm in France will be determined within a range of 255 to 310 EUR/MWh[27]. The UK government awarded reference prices for several tidal projects in 2023 and 2024. The common price awarded for all projects in 2024 was 204 EUR/MWh. This reference price decreased by 33% compared to 2023 (303 EUR/MWh), witnessing significant progress in terms of cost reduction, and a decrease of LCOE for tidal energy[28].
Ocean energy projects receive significant amounts of investment from public and private sources. Most ocean energy projects in the EU and the UK benefit from EU funding. 70 projects were funded under Horizon 2020 between 2014 and 2022, totalling EUR 183 million for ocean energy projects, including EUR 94 million for tidal energy and EUR 89 million for wave energy. Over this period, the financial support coming from the EU reached EUR 112 million, included EUR 50 million for tidal energy and EUR 62 million for wave energy. Since the beginning of the Horizon Europe financing period in 2022, 15 projects have been funded by the EU, for a total amount of EUR 51 million, including EUR 10 million for tidal energy and EUR 41 million for wave energy. These amounts are complemented by private and national public funding. According to the International Energy Agency (IEA), public R&D investment in ocean energy reached EUR 48 million in Europe for the year 2022, accounting for 53% of the global figure[29].
In addition to its support to research & development, The EU also accompanies the most advanced projects on their path to commerciality, notably through the EU Innovation fund (EUR 31.3 million for Normandies Hydroliennes) and the European Innovation Council Accelerator program (EUR 17.5 million for CorPower). EU-based ocean energy companies secured significant amounts of national funding for their most advanced projects, including French company Hydroquest from the French government (EUR 65 million in Flowatt project), Spanish company Magallanes from the Welsh government (EUR 9.3 million investment in Morlais project) and Swedish company Minesto from the Swedish energy agency (EUR 0.25 million for upgrading its mooring system). Investments from the private sector materialise in cooperations between specialized SMEs and energy majors, notably through venture companies. CorPower has partnered with TotalEnergies on device installation, maintenance and operation, with ESB and Simply Blue on a project in Ireland. Wavepiston cooperates with Shell on identifying wave energy opportunities, with Ørsted on an offshore wind and wave energy project, HydroQuest partnered with Qair on the Flowatt project. Minesto is working with energy utility SEV in its project to supply electricity to Faroe Islands[30]. According to JRC SETIS, a total amount of EUR 922 million have been invested by EU companies in the period 2010-2020. Over this period, 64% of these investors consisted of venture companies[31].
The ocean energy sector already provides economic benefits by directing public and private investment towards creation of jobs. The nature of these jobs depends on the readiness level of technologies. At the early stages of development, ocean energy projects tend to finance jobs in Research & Development. In a second stage, when an innovation is promising, the creation of specialised SMEs brings additional jobs dedicated to management, administrative tasks and communication. Scaling-up of projects and the energy device deployment on sea mobilise further work in financing, civil engineering and maintenance. In 2023, ocean energy projects were estimated to mobilise at least 415 FTE in the EU (532 FTE including the UK) within specialised ocean energy companies (energy device providers)[32]. On average, the identified companies employ 10 FTE (13 FTE for tidal energy, 9 FTE for wave energy). The largest of these specialized companies, such as CorPower or Minesto, employ over 50 FTE, both in the main industrial facility and near testing locations.
| Progress in ocean energy technology development opens prospects for EU-based specialized companies to export technologies on the global market, including beyond European waters. Over the past years, global patent flows have already been indicating EU-based companies’ export potential, with more EU actors seeking protection for their technologies on the extra-EU market than extra-EU companies in the EU[33]. In 2024 and 2025, this potential has begun to concretize. Swedish-Israelian company Eco Wave Power has concluded a partnership with the Indian oil company Bharat Petroleum to develop a wave energy project in India[34]. The same company has also recently been granted a permit for the installation of its wave energy system in the USA[35]. Danish company Exowave has established a joint-venture with US company AquaX to deploy wave energy in the Americas. Another Danish company, Wavepiston, has completed a 6-month feasibility study to evaluate wave energy potential in Barbados[36]. Swedish company Minesto, which presented an ambitious plan for deploying its tidal technology in the Faroe Islands, has been recently granted support by the Swedish energy agency with an aim to expand its activity to Asia[37]. |

1 The first offshore wind farm (Vindeby) was installed in Denmark in 1991 and decommissioned in 2017, after 25 years of useful life.
2 JRC analysis based on GWEC (2025) and 4C OFFSHORE (2025) WIND FARMS DATABASE.
34COffshore, 2025 - based on European Wind Energy Competitiveness Report Adaptation and extension of calculations made by Deloitte for etipwind.eu
5 4COffshore, 2023 - Floating wind: Industry focus.
6 4COffshore, 2023 - Floating wind: Industry focus.
7 A binding agreement in which a buyer agrees to purchase a portion or all of a producer’s future output at predetermined terms
9 COM(2020) 741.
32 This estimate represents only part of the workforce within the ocean energy sector, for which data was available (employees of ocean energy device provider companies). It does not include jobs within either civil engineering companies or larger energy companies (for example in the offshore fossil industry).