
Marine renewable energy includes both offshore wind energy and ocean energy, two green energy resources that are key to the EU’s ambitions to decarbonize its energy sector.
The most established marine energy sector is the offshore wind industry, where bottom-fixed offshore technology still represents the majority of projects, but there is a trend towards floating offshore technologies. Ocean energy is a promising sector, where the EU has shown a leading role in technology development.
EMODnet Map wiever allows to see the distribution of plants in Europe.
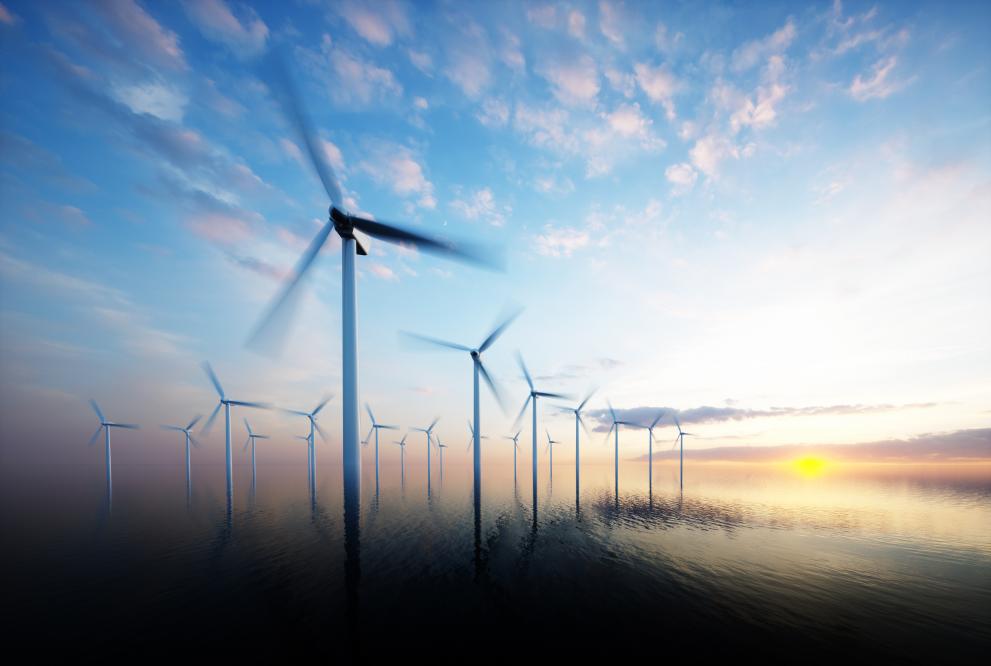
Offshore wind energy is currently the only commercial deployed marine renewable energy with wide-scale adoption. From only a small number of demonstration plants1 in the early 1990s, the EU now hosts a cumulative capacity of 17.8 GW of offshore wind, spread across 11 countries2. In late 2023, 993 MW of new capacity were added to the grid (provisional data). In addition, a number of projects of common/mutual energy infrastructure interest highlight investment on offshore wind capacity in various Member States3. By 2050, all non-land locked Member States (21) are projected to have varying levels of offshore wind capacity. Offshore wind represents over 30% of total wind capacity in 11 Member States (Malta (88%), Netherlands (59%), Finland (55%), Denmark (48%), Poland (48%), Germany (44%), Ireland (36%), Latvia (34%), Belgium (34%), Sweden (33%) and Estonia (33%)) according to PRIMES’s model reference scenario projections4.

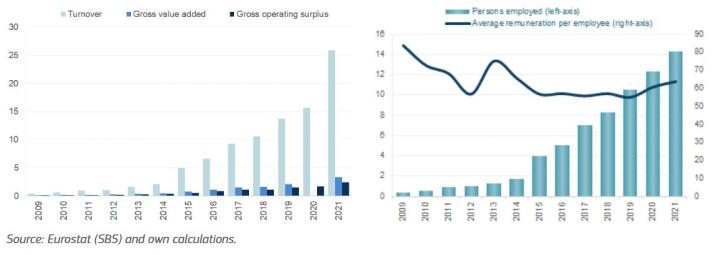
Based on Eurostat data on (exclusively) production and transmission, the sector generated more than €3.3 billion in GVA in 2021, a 39% increase compared to 2020. Gross profits accounted for €2.4 billion, up 45% since 2020; and the reported turnover was about €25.9 billion, up 65% since 2020.
The sector directly employed 14.3 thousand persons, up from less than 400 persons in 2009. Personnel costs totalled €912 million. The average annual wage, estimated at €63.8 thousand, is almost 24% lower compared to 2009 (€83.8 thousand) (Figure 1).
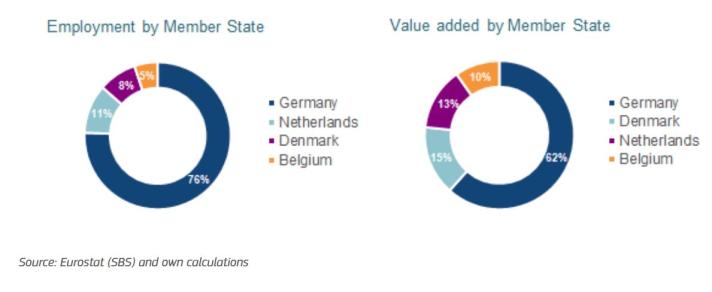
Germany currently leads in offshore wind energy with 76% of the jobs (10 800 people) and 62% of the GVA, followed by the Netherlands (1 500 people), Denmark (1 200 people) and Belgium (700 people). The sector is undergoing major expansion. 86% of jobs are related to the Production of electricity, with the remaining to Transmission of electricity.
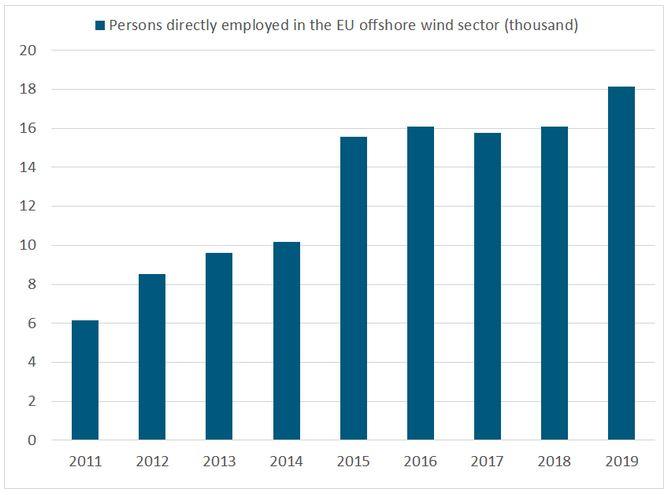
WindEurope has calculated direct jobs in the European (EU and UK) wind offshore sector5. These numbers incorporate different activities along the chain (as opposed to those presented by EUROSTAT, which only include production and transmission), such as developers, turbine and substructure manufacturers, and service providers, for the years 2011 to 20196. In the last year of the time series about 18 100 people were employed in the EU offshore wind sector, and specifically 3 650 in the development, 9 250 in the manufacture (4 950 for wind turbines and 4 300 for substructures), 5 200 in the provision of the service.
In terms of GVA, the top contributors, in descending order, include Germany with 62% (€2.1 billion), Denmark (€504 million), the Netherlands (€453 million) and Belgium (€324 million). Production of electricity contributes to 79% of the GVA, whilst Transmission of electricity to 21%.
During the last 15 years, the wind energy sector saw a strong increase in offshore wind technologies due to the development of higher capacity turbines, much larger site availability and a remarkable cost reduction, supported by important technological advances, such as wind turbine reliability. Significantly, the development of Europe’s offshore, wind sector has benefitted from lessons learned in the onshore wind sector such as addressing grid capacity issues and the use of competitive tendering.
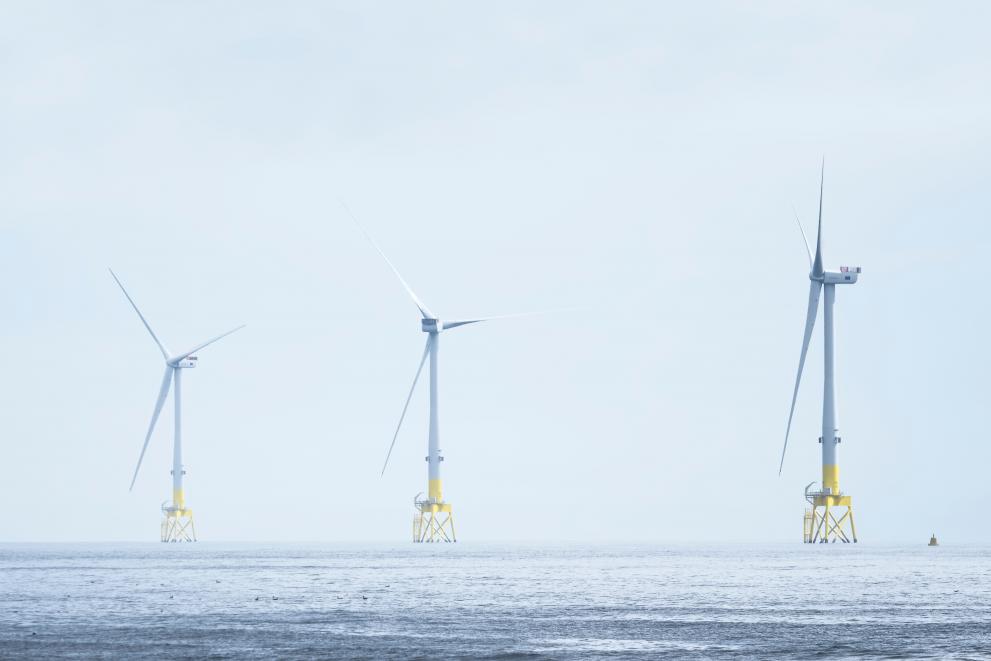
Offshore wind will play a significant role in Europe’s carbon-neutrality targets. The European Commission Offshore Renewable Energy Strategy7 was published in November 2020 as part of the EGD roadmap. The Strategy outlines the ambition to deploy 300 GW of offshore wind energy by 2050, with an intermediate target of 60 GW by 2030. To increase the rollout for renewables, in October 2023, the European Council adopted the revised Renewables Energy Directive8, which raises the target for renewables to 42.5% of the overall energy consumption by 2030 and aims to accelerate the permit procedures for renewable energy projects. New roadmaps for offshore wind projects were also published and organised at sea basin level, in order to deliver better visibility on the pipeline of projects. Together, these roadmaps set an ambition of approximatively 111 GW by 2030 (i.e. an almost doubling of the 60 GW ambition set initially in the Offshore Renewable Energy Strategy in 2020), rising to 317 GW by 2050.
From being a pioneer in the offshore sector (the first offshore wind farm was installed in Denmark in 1991) the EU has developed into a global leader in offshore wind, exporting equipment and expertise worldwide. By the end of 2023, the cumulative installed capacity reached 17.8 GW for offshore wind in the EU, with an increase of 993 MW in the last year (Figure 4). The largest capacity additions for 2023 were in the Netherlands (390 MW), Denmark (344 MW) and Germany (257 MW). After a peak in deployments in 2020, the relative slow-down in EU waters since 2021 is partly due to the delays faced by offshore wind companies, due to, amongst others, supply chain disruptions and permitting delays. Globally, China is leading the sector in terms of deployments and in 2023 expanded its position as the world’s largest offshore wind market with 34 GW of installed capacity, more than the UK (14.8 GW), Germany (8.3 GW) and the Netherlands (3.7 GW) combined.
As with onshore wind, as the operational lifespan of offshore wind turbines is reached, the decommissioning and repowering (with new, higher capacity turbines) will become more commonplace. 123 turbines already reached 20 years of operation by 2023, and about 3.5 GW of global offshore capacity will reach its designed operational life of 20-25 years by 2035. Performing this operation in the offshore environment will be far more challenging than on land.
The Levelized Cost of Electricity (LCOE) of bottom-fixed offshore wind energy has decreased with larger offshore wind energy deployment. For 2023, BNEF reports LCOEs for offshore wind of 60-110 €/MWh in Denmark, 62-132 €/MWh in Germany, 66-125 €/MWh in the Netherlands, 82-160 €/MWh in Poland and 155-232 €/MWh in France9.
Floating wind energy is an emerging sector within the offshore wind industry that is progressing steadily toward commercial viability. Floating wind enables deployment in deeper water compared to bottom-fixed turbines, increasing the potentially available marine space. This is particularly attractive for Member States whose deep-water seas (>50 m) have so far limited the development of conventional fixed bottom offshore wind energy. Several projects are already operational, and many are planned for the next few years.
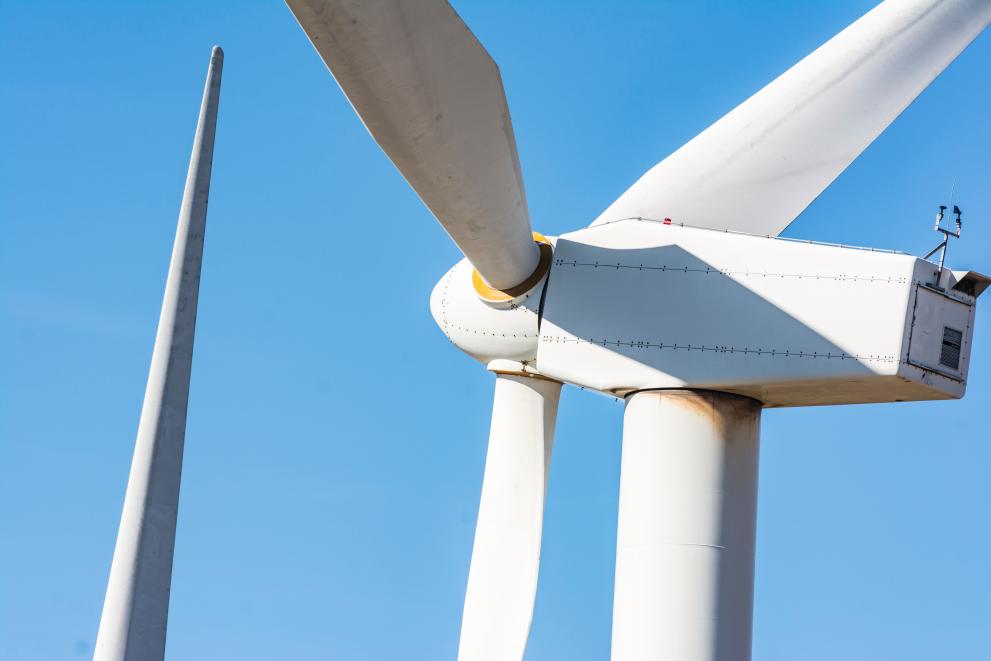
Technological differences between projects are mainly linked with the floating structure. Most projects use semi-submersible floater technologies, while fewer projects use spar-buoy, barge, tension-leg platforms or semi-spar floater technologies. Semi-submersible and spar-buoy technologies already reach Technology Readiness Level (TRL) 8-9, while the Floatgen pilot project in France upgraded the concrete barge technology to TRL 7-8. Tension-leg platform technology is tested with a prototype (TRL 6) launched off the coast of Canary Islands by the X1 Wind project.
Current floating wind energy projects in the EU account for 29 MW of installed capacity10. One of the first floating wind projects in the EU was the WindFloat 1 project in Portugal, whose initial 2 MW capacity (2011) has since been scaled-up to 25 MW (in the newly-named WindFloat Atlantic project, 2019); later followed by the Floatgen project in France with 2 MW capacity, operational in 2018. More recently in 2023, Spain deployed a 2 MW project, SATH, showcasing the continued interest for the technology. National ambitions to further develop the floating wind sector are evident, with multiple auctions planned in France, Spain, Italy, Portugal and Greece, and installed capacity is expected to grow towards 3 GW by 2030 and 11 GW by 2035-2040. Floating wind is also expanding worldwide, with an installed capacity expected to reach more than 12 GW by 2030 and over 38 GW by 2035-2040.
The LCOE of floating wind is currently higher than that of bottom-fixed wind, and with multiple floating technologies still in development, the LCOE is also more project-dependent. For the years 2020-2023, we find a global range of LCOE between 145 €/MWh (Hywind Tampen project in Norway) and 350 €/MWh (Fuyao project in China), with WindFloat Atlantic in Portugal at an intermediate LCOE of 240 €/MWh11.
In addition to the offshore wind industry, ocean energy technologies offer a complementary option for developing marine energy production. Ocean energy projects utilize a range of technologies that harness tidal, wave, ocean thermal energy conversion, and salinity gradient from the oceans. These projects attract both public and private investments, with some of the more advanced projects reaching high TRL and LCOE slowly approaching those of more established offshore energy sectors – even if commercial exploitation remains a challenge. The 2020 EU strategy on offshore renewable aims to increase the contribution of ocean energy to the offshore EU goals, from 1 GW in 2030 to 40 GW in 205012. By enabling the offshore exploitation of energy sources other than wind, these technologies could expand the scope of offshore renewable energy supply.
Tidal energy is the first of the ocean energy technologies to have been implemented at a large scale, with barrages in France (1966), China (1975, 1985) and South Korea (2011). These barrages make use of tidal range technology, which captures the potential energy stored between a basin and the external sea. While tidal range projects are commercially viable (thanks to their similarity with the hydropower sector), the deployment of such facilities has been limited by the availability of suitable locations and by the significant local environmental impacts. New technologies have emerged as an alternative, exploiting tidal stream rather than tidal range. These tidal stream technologies include horizontal axis turbine (TRL 9), tidal kite (TRL 8), enclosed tips (TRL 7), vertical axis turbine (TRL 7), undulating membrane (TRL 7) and oscillating hydrofoil (TRL 6). Specifically, horizontal axis turbines have been developed, installed and operated by several European companies, including Dutch company Tocardo, French company Sabella and Spanish company Magallanes Renovables; and by British companies Proteus Marine Renewables and Nova Innovation. Regarding tidal kite devices, the Swedish company Minesto has recently achieved grid connection of its larger device of 1.2 MW, in early 2024. In addition, vertical axis turbine and undulating membrane technologies are currently being tested at scale in their operational environment by Water2Energy in the Netherlands and EEL Energy in France.
Apart from tidal energy technologies, energy from the ocean can also be derived by the surface motion of ocean waves. Wave energy technologies include oscillating water column (TRL 9), point absorber (TRL 9), attenuator (TRL 8), overtopping (TRL 8), oscillating wave surge converter (TRL 7) and rotating mass (TRL 7). Oscillating water column devices have been developed, installed and operated in breakwaters by former Scottish company Wavegen and EVE in Spain, and by Wavenergy.it in Italy. The point absorber technology has been scaled-up and operated by Swedish-Irish company Seabased in Sweden, and it is being further developed by Swedish company CorPower in Portugal and by AWS Ocean Energy in the UK. An attenuator system is currently being tested with its own energy storage capacity in the UK by Mocean, in cooperation with Verlume and TotalEnergies. The most advanced oscillating surge wave converter and rotating mass technologies are also being tested at scale in their operational environment by GEPs Techno in France, and by Wave for Energy, in cooperation with Eni, in Italy.
Ocean thermal energy conversion (OTEC) exploits the temperature difference between deep cold water (at 800 to 1 000 m depth) and surface warm water. The technology has been tested by developers in Japan and the USA (TRL 8), and at a smaller scale in China and India.
Salinity gradient power (or osmotic power) uses salt content differences between freshwater and saltwater. This technology has mainly been tested in European sea basins, for example the demonstration plant in the Netherlands using Reverse Electrodialysis technology (RED, TRL 7).
Given the different dynamics for both installation types, this section differentiates ocean energy capacities between those using emerging technologies (tidal stream, wave, OTEC, salinity gradient) from the infrastructures using the established tidal range technology.
At the end of 2023, emerging operational EU ocean energy capacities (i.e. ocean energy capacities excluding the already-established tidal range technology projects) account for 2.18 MW, including 1.16 MW for tidal energy, 0.97 MW for wave energy and 50 kW for salinity gradient. In 2023, 715 kW of emerging ocean energy capacities were installed in the EU, a significant increase compared to the 150 kW additions in 2022 (see Figure 5). The most significant operating tidal energy capacities in the EU are the Sabella turbine in France (1 MW, operating since 2015) and the Water2Energy vertical axis turbine in the Netherlands (100 kW, 2021). For wave energy, the most significant operating capacities are the Mutriku wave array in Spain (296 kW, 2011), the CorPower device in Portugal (300 kW, 2023) and the Wave for Energy device in Italy (250 kW, 2023). The 50 kW capacity for salinity gradient represents the device developed by Redstack and operating since 2014 in the Netherlands. There are currently no operating capacities in the EU nor in Europe for OTEC technologies. Globally, operating capacities at the end of 2023 reach 12.6 MW for tidal energy, 1.96 MW for wave energy, 200 kW for OTEC, and 50 kW for salinity gradient17.
The only established ocean energy capacity in Europe, the La Rance tidal barrage (240 MW), has experienced capacity losses over the past decades due to the aging installation. This led the whole ocean energy capacity in the EU27 (emerging and established capacities that are operational) to remain relatively stable over the past 10 years (2014-2023), despite new additions in emerging ocean projects. The barrage should recover part of its initial capacity after the current phase of renovation (2021-2026). Only four tidal range power plants are currently operational in the world: La Rance in France, Sihwa in South Korea, Haishan and Jiangxia in China. Their combined capacity reached 469 MW in 202313. Since 2011, no new project using tidal range technology has been developed.
In 2023, according to the IRENA, the whole operational ocean energy capacity (both emerging and established) reached 527 MW globally. Globally, the cumulative capacity (i.e. operational and decommissioned capacity) for emerging ocean technologies reached 67.8 MW in 2023. This is split into 41.4 MW for tidal stream energy, of which 30.5 MW in European sea basins; and 26.4 MW for wave energy, of which 13.3 MW in European sea basins. This means that 65% of the total capacity (43.8 MW out of the 67.8 MW) is located in European sea basins. Europe has historically been at the forefront of the ocean energy sector. After a period of reduced investments, there is now a resurgence of new projects. In 2023, significantly more new capacities were installed in Europe and the EU27 compared to 2022, and the project pipeline is witnessing a positive dynamic for the next years.
Emerging ocean energy technologies are not established enough to be commercially viable through their revenue from energy production. The main economic indicators available for the sector are the LCOE and the investments (public and private).
According to the latest estimate from IRENA (2019), LCOEs range from 110 to 480 €/MWh for tidal energy, and from 160 to 750 €/MWh for wave energy. Current costs for tidal energy can be estimated by analysing the most recent contracts of difference awarded to tidal energy projects. In the UK, the 4 projects Orbital Marine Eday 1, Orbital Marine Eday 2, Morlais Magallanes GR3, and MeyGen Phase 2 have been awarded a common purchase price of 210 €/MWh14. In France, the price of electricity purchase from FloWatt project is expected to reach 240 €/MWh, an amount similar to the one applied to floating wind projects. No information is available on potential electricity purchases from wave energy projects.
Most ocean energy projects in the EU and the UK benefit from EU funding. An increasing number of projects were funded under Horizon 2020 for the years 2014-2020 (64 projects), compared to the 7th framework program for 2007-2013 (22 projects). Horizon 2020 mobilised 185 million euros for ocean energy projects (+83% compared to the 7FP), including 92 million euros for tidal energy (+73%) and 86 million euros for wave energy (+93%). Overall, the share of the EU contribution in total funding of these projects still decreased from 51% to 37% for tidal energy projects, and from 79% to 72% for wave energy projects. This evolution, while the total amount of projects funding is rising (378.4 million euros under Horizon 2020 compared to 55.9 million under FP7) is linked to the take-off of private investments, in particular for tidal energy projects15. New projects supported under the Horizon Europe program (2021-2027) are currently being launched, such as the MAXIBlade project for tidal energy (2023-2028, 1.75 million euros) and the WEDUSA project for wave energy (2022-2026, 13.1 million euros).
For now, no significant revenue is generated by the ocean energy sector. The few projects currently connected to the grid are either operated by the public sector or face difficulties in reaching commercial viability. The implementation of subsidised purchases (contracts of difference) mentioned above will give a better idea of the potential revenue generated from electricity production in the short and medium term. However, the ocean energy sector already provides economic benefits by directing public and private investment towards employment opportunities. The nature of these jobs depends on the readiness level of technologies. At the early stages of development, ocean energy projects tend to finance jobs in academia, including researchers, engineers and technicians. In a second stage, when an innovation is promising, the creation of specialised SMEs brings additional jobs dedicated to management, administrative tasks and communication. Scaling-up of projects and the energy device deployment on sea mobilise further workloads in financing, civil engineering and maintenance. Overall, ocean energy projects are estimated to mobilize at least 415 full time equivalent (FTE) in the EU (532 FTE including UK) within specialized ocean energy companies (energy device providers). This estimate represents only part of the workforce within the ocean energy sector (for which data was available), specifically people employed by ocean energy device provider companies. Therefore, it does not include job creations from either civil engineering companies or larger energy companies (for example; in the offshore fossil industry) who also contribute to ocean energy projects.
1 The first offshore wind farm (Vindeby) was installed in Denmark in 1991 and decommissioned in 2017, after 25 years of useful life.
2 JRC analysis based on GWEC (2023) and 4C OFFSHORE (2023) WIND FARMS DATABASE.
3 See Commission Delegated Regulation (EU) 2024/1041 of 28 November 2023.
https://eur-lex.europa.eu/legal-content/EN/TXT/HTML/?uri=OJ:L_202401041…;
4 European Commissionc, Directorate-General for Climate Action, Directorate-General for Energy, Directorate-General for Mobility and Transport, De Vita A, Capros P, Paroussos L, Fragkiadakis K, Karkatsoulis P, HöglundIsaksson L et al. EU reference scenario 2020 : energy, transport and GHG emissions : trends to 2050. Publications Office; 2021, doi: 10.2833/35750.
5 It is assumed that the EU to UK share of employment are determined by the ratio of offshore wind installed capacity. Due to the assumption, this calculation may still underestimate EU employment.
6 WindEurope, “Wind energy and economic recovery in Europe – How wind energy will put communities at the heart of the green recovery”, 2020.
7 COM(2020) 741.
8 PE/36/2023/REV/2.
9 Analysis derived from BNEF 2023.
10 4C OFFSHORE (2023) WIND FARMS DATABASE.
11 4C OFFSHORE “Floating wind: Industry focus” (2023).
12 COM(2020) 741.
13 https://www.ocean-energy-systems.org/publications/oes-annual-reports/document/oes-annual-report-2023/ (original capacities); https://mc-cd8320d4-36a1-40ac-83cc-3389-cdn-endpoint.azureedge.net/-/media/Files/IRENA/Agency/Publication/2023/Jul/IRENA_Renewable_energy_statistics_2023.pdf?rev=7b2f44c294b84cad9a27fc24949d2134 (updated evolution).
14 https://assets.publishing.service.gov.uk/media/65b1463d160765000d18f834/contracts-for-difference-cfd-allocation-round-4-results.pdf (original source); https://www.offshore-energy.biz/uks-fourth-contracts-for-difference-round-awards-40mw-of-new-tidal-power-capacity/ (conversion in euro).
15 Based on Cordis data.