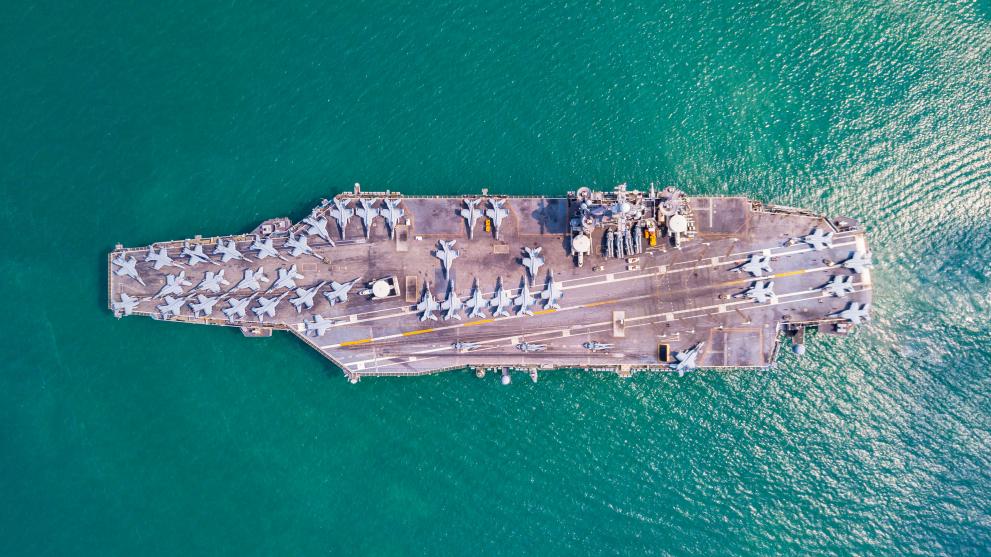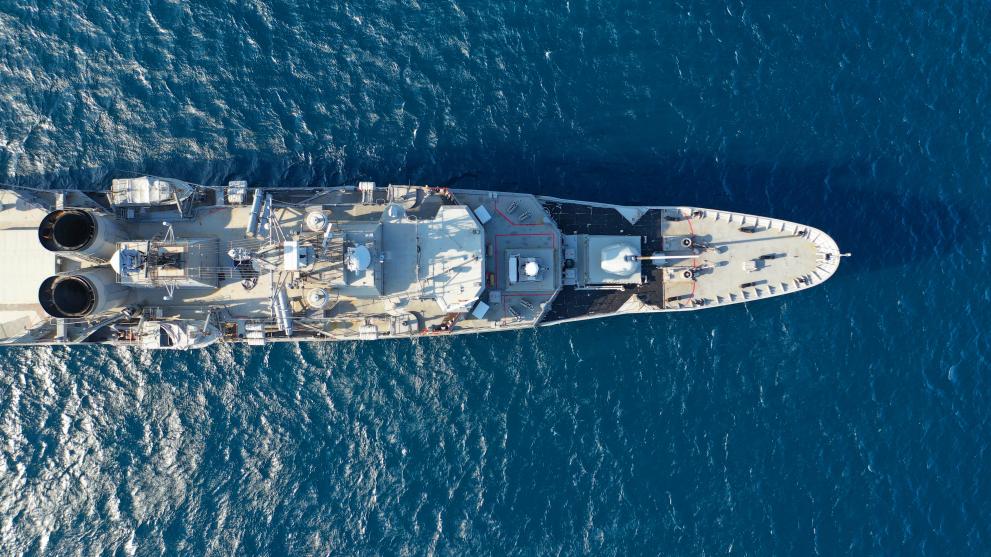
The Maritime defence, security, and surveillance sectors are gaining relevance, expanding, and increasingly overlapping, driven by technological innovations and applications for military and civilian uses.
The monitoring of the seas around the EU, and beyond, requires close collaboration and coordination among Member States. The The European Defence Action Plan provides a policy foundation for strengthening cooperation among Member States and aligning defence investments with common strategic objectives. The European Commission and its agencies (EFCA, EMSA, FRONTEX for civilian support tasks EDA, SatCEN also for military) implement various actions within the framework of the EU’s maritime security strategy (EUMSS), for instance, through the Common Information Sharing Environment (CISE), one of the EU MSS's deliverables.
There is a renewed urgency to rapidly develop naval capabilities in order to strengthen Europe’s defence (Férey 2022). This objective has been emphasised in the Strategic Compass released in 2022 (progress report 2024), which identifies the “mapping of industrial capabilities” as a key priority. In 2023, the first-ever European Defence Industrial Strategy (EDIS) was announced to strengthen the European Defence Technological and Industrial Base (EDTIB) and achieve defence industrial readiness, in the face of Russia’s unprovoked war of aggression against Ukraine. Following this, the European Defence Industry Programme (EDIP) was adopted, which provides EUR 1.5 billion in grants for the period 2025- 2027, out of which EUR 300 million is dedicated to the Ukraine Support Instrument.

In 2025, the Commission proposed several key initiatives to boost European defence readiness and investment. The White paper for European defence - Readiness 2030 acts as a roadmap to rearm Europe by supporting defence production and facilitating defence investments. To this end, the ReArm Europe Plan, as part of Readiness 2030, aims to scale up defence investment by launching a EUR 150 billion loan instrument under the Security Action for Europe (SAFE) for Member States to invest in defence capabilities. The Defence Readiness Omnibus Simplification further reflects the priorities set out in Readiness 2030 by simplifying regulatory and administrative frameworks that slow down production and acquisition processes.
As part of the multi-annual financial framework for the period 2021-2027, the European Defence Fund (EDF) aims to support the research and development of collaborative defence products and technologies with a budget of close to EUR 8 billion. Initiatives such as the EU Defence Innovation Scheme (EUDIS) under the EDA offer SMEs, including startups, access to the European Defence Fund. Under the EDF 2026 Work Programme, the EUDIS Business Accelerator will support European start-ups over an 8-month programme to strengthen their business development and enter the defence market.

Economic weight of the defence sector
Since 2006, the European Defence Agency (EDA) has collected annual defence data in line with the Agency's Ministerial Steering Board Decision.
In the Defence Data report for the year 2024-2025, EDA reported that in 2024, the total defence expenditure by the 27 EU Member States reached EUR 343 billion, increasing by 19% over the previous year. This equals 1.9% of the GDP, just below the 2% NATO guidelines. Estimates suggest that EU Member States will go over this threshold in 2025, potentially reaching EUR 392 billion.
In 2024, EU defence investment was close to EUR 106 billion, accounting for 33% of total defence expenditure. The trend is projected to continue in 2025, bringing defence investment spending closer to EUR 130 billion. Defence equipment procurement expenditure reached EUR 88 billion, growing by 39% on a year-to-year basis, whilst defence Research and Development (R&D) spending increased by 20%, reaching EUR 13 billion in 2024. R&D spending is expected to rise to EUR 17 billion in 2025, representing a historical peak.

Output value for maritime defence vehicles
According to the JANES database, the total output value of the EU production industry for maritime defence was EUR 13.7 billion in 2025. This amount included both manned and unmanned technologies assembled in 24 EU Member States (intended as countries of final assembly)[1]. In 2025, ships accounted for 65% of the value, followed by submarines, with 27% of the value, and fixed-wings aircrafts[2], with 2% of the value. Unidentified R&D accounted for 5% of the total value (Figure 1).
Regarding market segments by function of sea vehicles, frigates account for 25% of the output value, recording roughly EUR 3.5 billion in 2025, followed by attack submarines with 20% of the value, corvette ships (9%), logistic/support ships and ballistic submarines (both at 7%). Value is determined by the size and complexity of the equipment. Output has increased across all main vehicle categories over the past 10 years (2016-2025). Strong increases were registered for logistic support ships (+276%) and corvettes (+188%), whereas limited increases were recorded for frigates (+1%) and attack submarines (+7%) (Figure 2).
2. Breakdown by country of production
Over the 2016-2025 period, total EU production for maritime defence amounted to EUR 117.8 billion (output value). It has expanding by 42.4% in nominal terms throughout the decade, with the sharpest increase registered in 2022 (+23.6%). The largest EU producers are France, Germany, Italy, and Spain – which account for 87% of the entire production, together. Next, the Netherlands, Sweden and Poland account for another 8% of total EU production (Figure 3).
Source: Own elaboration based on JANES database
Note: Pan-European production values (amounting to EUR 401.5 billion) are not represented in the map.
In 2025, France generated the largest proportion (37%) of EU output value of maritime defence vehicles (in terms of final assembly of both manned and unmanned sea vehicles), followed by Germany and Italy (both 19%) and Spain (8%). The main European navies are therefore concentrated in countries that produce military vessels, where state involvement and public support are significant (e.g. past public arsenal history in France, Spain and Italy)[3].In total, these top four EU Member States accounted for roughly 82% of the total EU output value and 60% of the total EU defence expenditure[4] (Figure 4).
3. Breakdown by main production companies
Based on JANES data, for the year 2025, the main producers of maritime defence vehicles in the EU are Naval Group (based in France) with 24% of the output value specialising in advanced surface combatants (frigates and corvettes), and nuclear-powered submarines, unmanned surface and underwater systems; followed by Fincantieri (Italy) with 15% is one of Europe’s largest shipyards, building warships (frigates, patrol vessels, amphibious ships and submarines), and through subsidiaries like WASS, underwater defence systems such as torpedoes and sonars; next, Thyssenkrupp Marine Systems (TKMS, Germany) with 8%, focuses on building surface vessels and submarines; and Navantia (Spain) with 7% constructs multi-mission frigates, AIP-equipped submarines, aircraft carriers and patrol vessels (Figures 5 and 6).
Other large manufacturers include Damen Shipyards (Netherlands), which build naval ships and patrol vessels; NVL Group (Germany), which delivers advanced naval vessels, including frigates and specialised fleet support ships; and Saab Underwater Systems (Sweden) is known for its submarine design and underwater warfare solutions including modern combat submarines.
According to publicly available sources, Naval Group is engaged in the production of FDI frigates, Scorpène and Barracuda attack submarines and minehunter ships, as well as a new aircraft carrier involving a large number of French companies. Fincantieri is leading the modernization of the Italian Navy through the production of FREMM frigates,U212NFS attack submarines and multipurpose combat ships. Thyssenkrupp is engaged in the production of F frigates, types 214 and 212CD attack submarines. Spanish shipbuilder Navantia is leading the modernization of F100 frigates and the production of S-80 and S-82 attack submarines. The Swedish company Saab is engaged in the production of A26 attack submarines.
Focus on unmanned vehicles
In February 2026, the Commission launched an Action Plan to counter the increasing threats posed by drones to EU security. The Action Plan is designed to support Member States through coordinated actions, complementing national measures and focused on key priorities: enhancing preparedness, boosting detection capacities, coordinating responses and strengthening the EU's defence readiness.
The maritime domain is particularly susceptible to threats and attacks by aerial, surface and underwater drones. Therefore, one of the objectives of the Action Plan is to enhance maritime surveillance and to protect critical infrastructure in the maritime domain. To this end, the Plan targets maritime surface and undersea drones, and related counter-drone capacities.
The total output value for unmanned vehicles (e.g. aerial and submarine drones) increased by 132% over the past 10 years (2016-2025), reaching 6% of the total output value of maritime defence vehicles, with EUR 847 million in 2025. Fixed-wings account for 33% of the total output value for unmanned vehicles (EUR 277 million), increasing by 112% over the past 10 years. Submarines account for 12% of the output value, decreasing by 23% over the same period. Unidentified R&D also account for 33% of the total output value for unmanned vehicles. The largest market segment in value, with respect to function is multirole vehicles (31% of the value with EUR 294 million), followed by vehicles dedicated to mine warfare (12%) and to C2/ISR[5] (6%) (Figure 7).
According to JANES data, the main companies involved in the production of unmanned vehicles in the EU include WB Electronics (Poland), Safran (France), Exail (France) and Saab (Sweden). Naval Group, Fincantieri, and Saab are also directly investing in these technologies. In addition to these well-established, large companies, many small and medium enterprises (SMEs), including start-ups, have recently emerged in the expanding defence market, driven by evolving warfare requirements and the Ukrainian context (e.g., naval kamikaze drones, seabed warfare, and the return of mine warfare)[6].

Extra-EU trade
In 2025, EU exports of maritime defence vehicles towards non-EU countries amounted to EUR 2.1 billion. The largest extra-EU exporting country was Germany (46%), followed by France (19%), Italy (17%) and Spain (11%). The remaining 7% of extra-EU export originated from the Netherlands, Romania, Austria, Poland and Sweden (Figure 7). On the other hand, EU imports from non-EU countries totalled EUR 0.7 billion in 2025. The largest importing countries were: Germany (25%), Italy (18%), Romania (15%), France (12%) and Spain (10%)[7] (Figure 8a+8b).

Over the past 10 years (2016-2025), extra-EU exports have decreased by 16% (from EUR 2.6 billion in 2016 to EUR 2.1 billion in 2025), while extra-EU imports have shown a 6-fold increase (from EUR 121 million to EUR 750 million, i.e. +520%). This situation resulted in a strong deterioration of the EU trade balance for maritime defence vehicles (-45%), which remains positive nonetheless, at EUR 1.3 billion. Both extra-EU exports and the EU trade surplus for maritime defence vehicles reached their highest value in 2021, respectively EUR 4.8 billion and EUR 4.4 billion (Figure 9).
Over the past five years (2020-2025), the EU has met growing procurement needs by increasing extra-EU imports (+89%), whereas the value of EU production of maritime defence vehicles (by country of final assembly) only increased by 19%, and remained relatively stable since 2022 (-4%). In 2025, the value of maritime defence vehicle spending by 24 end-user EU Member States[8] for domestic use reached EUR 11.6 billion, the highest on record (+42% since 2016) (Figure 10).
2. Analysis of main trade flows
In 2025, the main destinations of EU exports were Norway (13%) and Indonesia (12%) (Figure 11). Frigates account for 29% of the extra-EU exports value, followed by attack submarines (14%) and ballistic submarines (10%). It should be noted that the value and destination of extra-EU exports can be strongly influenced by a limited number of large contracts, which may lead to significant variations over time[9]. For example, in 2021, the Norwegian government approved the procurement of four 212CD submarines from the German naval shipbuilding company ThyssenKrupp Marine Systems (TKMS). This was followed by two additional submarine orders in 2026, for a total order value of more than EUR 8.5 billion (spread over several years). Similarly, in 2025, the French company Naval Group signed an EUR 2 billion contract with the Indonesian government for technology transfer and the construction of two Scorpène submarines.
Source: Own elaboration based on JANES database
As regards maritime defence imports from non-EU countries (amounting to EUR 700 million in 2025), the main EU importing countries are Germany (25%), Italy (18%), Romania (15%), France (12%) and Spain (10%). The USA accounts for at least 41% of these imports in terms of output value, followed by Israel (12%) and Turkey (6%). Extra-EU imports focus mainly on electric equipment for C2/ISR[10] (43% of the value) and multi-role combat aircraft (42%) (Figure 12).
Source: Own elaboration based on JANES database
Intra-EU trade
Over the past decade (2016-2025), the five largest importers from other EU countries were France, Germany, Spain, Romania, and Italy (in this order). France was by far the largest intra-EU importer, procuring from other EU countries a total of EUR 57.9 million of maritime defence platforms (i.e. 50% of total intra-EU imports by the five countries together), mainly from Sweden. Germany’s intra-EU imports amounted to EUR 20.5 million, followed by Spain (EUR 19.6 million), Romania (EUR 12.5 million), and Italy (EUR 5.6 million) (Figure 13).

Throughout the decade, France has consistently been the largest intra-EU importer, except in 2021 (when Italy took the lead, with intra-EU imports amounting to EUR 3 million) and in 2023 (when Germany was ahead, importing EUR 8.7 million, mainly from Sweden). Their shares of total intra-EU imports for maritime defence generally ranged between 0% and 10%. This share peaked for France in 2016 and 2017, reaching 28% of total import value, and for Spain in 2017 at 24%. Between 2016 and 2018 and again from 2020-2021, it is estimated that none of Germany’s imports of maritime defence equipment and platforms originated from other EU countries.
Intra-EU exports
During the past decade (2016-2025), the five EU Member States exporting the most of maritime defence platforms to other EU countries were France, the Netherlands, Germany, Italy and Spain (in this order). France was by far the largest intra-EU exporter, securing a total of EUR 3.8 billion sales to other EU countries (representing 63% of total intra-EU exports by the five countries together). The Netherlands was the second largest intra-EU exporter with EUR 1.1 billion, followed by Germany (EUR 885 million), Italy (EUR 179 million) and Spain (EUR 100 million) (Figure 14).
Over the same period, the share of exports directed to other EU countries by these four producing countries ranged between 0% to 10% of total export value. A significant increase was observed only for France from 2022 onwards, with the share rising from 6% in 2021 to 74% in 2025. According to press releases and other publicly available sources, this surge is linked to the concurrent sale of FDI frigates to Greece, Barracuda-class attack submarines to the Netherlands and minehunter vessels to both the Netherlands and Belgium. No comparable increase in intra-EU export shares was observed for Germany, Italy, or Spain.
In addition, it is also worth noting the recent decision by the Polish Navy to procure Swedish A26 submarines, built by Saab, as part of the renewal of its submarine fleet.
The intra-EU trade balance of the four largest national maritime defence industries in the EU (France, Germany, Spain, and Italy) remained positive throughout the 2016-2025 decade. In the first five years, it fluctuated between EUR 117-176 million. Then, since 2021 it registered an 8-fold increase, reaching a surplus of EUR 1.4 billion in 2025 – attributed mostly to France.
Overall intra-EU trade was worth approximately EUR 1.8 billion in 2025 (output value). It has been steadily expanding in nominal terms over the 2016-2025 decade, with only a minor contraction (-7%) in 2021 (Figure 15).
Supply chain and international cooperation in the main EU producing countries
Capability development and joint cooperation in the EU are primarily driven by frameworks such as PESCO (2022–2027 cycle) and facilitated by Pan-European companies such as Airbus, as well as joint ventures such as Naviris (FR, IT), MBDA (UK, FR, IT, DE) or KNDS (FR,DE). Intra-EU projects provide a structured process for Member States to jointly plan, develop and invest in shared capability projects while enhancing the operational readiness and contribution of their armed forces. For instance, the European Patrol Corvette (EPC) project brings together Italy, France, Spain and Greece[11] to develop the next generation of Multi Modular Patrol Corvette (MMPC)-class of naval vessels. The EPC is developed by a consortium of companies including Naval Group, Fincantieri and Navantia, coordinated by Naviris, and supported by the European Defence Fund (EDF).
Most cooperation in defence supply chains takes place among EU countries. However, extra-European actors, particularly companies from the UK and the US, remain integrated into these supply chains. Companies such as Rolls-Royce and General Electric continue to play a role in the supply chains of the four main EU producer countries. Cooperation with non-EU partners often takes the form of targeted industrial partnerships, such as Thyssenkrupp’s collaboration with the Norwegian company Kongsberg on submarine systems.
Recent projects also reflect a growing trend toward internationalisation, with EU-based companies signing contracts to produce maritime defence vehicles in third countries, often including varying degrees of industrial offsets and technology transfer. For example, Brazil hosts the construction of Naval Group’s Scorpène submarinesand Thyssenkrupp’s Tamandare-class frigates. Indonesia and India are also expected to host submarine construction projects led by Naval Group and Thyssenkrupp.
[1] The source dataset does not include data for the following EU Member States: Cyprus, Luxembourg, and Malta.
[2] Fixed-wing aircraft are considered part of naval defence because they are operated under naval command structures, and they perform essential maritime missions such as maritime surveillance, anti-submarine warfare, and strike operations from aircraft carriers. For example, in France, Force de l'Aéronautique navale consists of 200 naval aircrafts (source : https://www.defense.gouv.fr/marine/force-laeronautique-navale)
[3] https://www.tandfonline.com/doi/full/10.1080/10242694.2024.2389000
[4] European Defence Agency
[5] Space Resilience, Command and Control (C2) / Intelligence, Surveillance and Reconnaissance (ISR)
[6] BERAUD-SUDREAU L, DROFF J, MALIZARD J, SZEGO E (2026) “ « New Defence » et politique industrielle de défense en Europe”, DEFENSE & Industrie, février 2026, N°22, p. 39-49.
[7] These figures include extra-EU imports by NATO, which are considered to be directed mainly to EU countries (source: JANES).
[8] The source dataset (JANES) does not include data for the following EU Member States: Cyprus, Luxembourg, and Malta.
[9]Droff J, Malizard J, Guiberteau-Ricard J (2022) “Les données sur les exportations d’armement : quels enjeux pour la littérature académique ? Le cas français”, Les Champs de Mars, 2022/1, n°38, p. 1253-1871.
[10] Space Resilience, Command and Control (C2) / Intelligence, Surveillance and Reconnaissance (ISR)
[11] Denmark and Norway as participating State and industry.